

168
9 Managing the Quality Systems
X
+3SD
X
+2SD
X
+SD
X
-SD
X
-3SD
X
-2SD
X
(a)
(d)
(b)
(e)
(c)
(f)
The result of determination
Next measurement
X
+3SD
X
+2SD
X
+SD
X
-SD
X
-3SD
X
-2SD
X
The result of determination
Next measurement
X
+3SD
X
+2SD
X
+SD
X
-SD
X
-3SD
X
-2SD
X
The result of determination
Next measurement
X
+3SD
X
+2SD
X
+SD
X
-SD
X
-3SD
X
-2SD
X
The result of determination
Next measurement
X
+3SD
X
+2SD
X
+SD
X
-SD
X
-3SD
X
-2SD
X
The result of determination
Next measurement
X
+3SD
X
+2SD
X
+SD
X
-SD
X
-3SD
X
-2SD
X
The result of determination
Next measurement
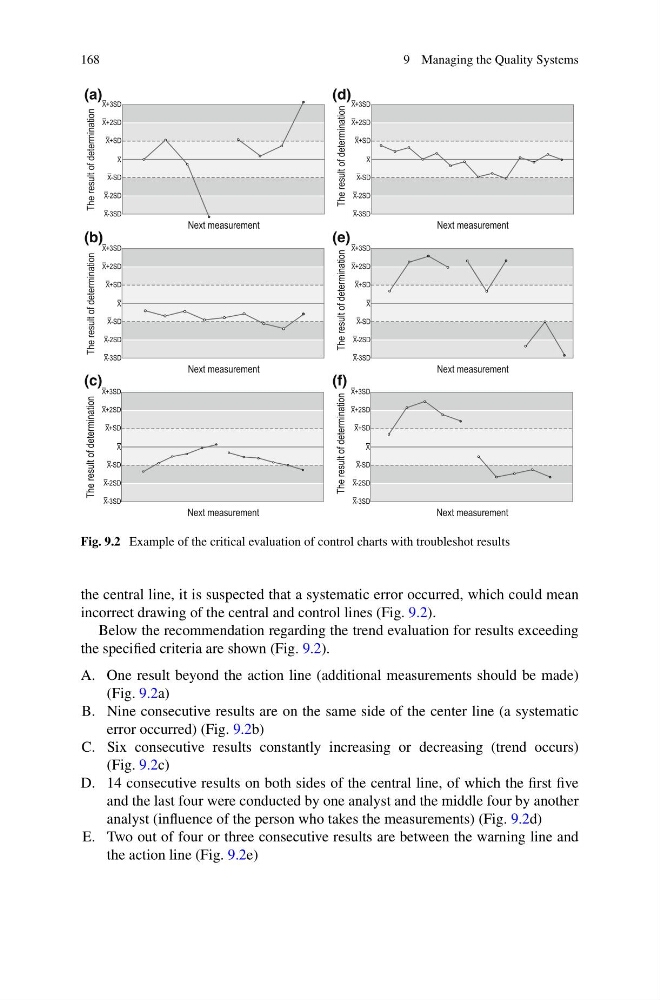
Fig. 9.2 Example of the critical evaluation of control charts with troubleshot results
the central line, it is suspected that a systematic error occurred, which could mean
incorrect drawing of the central and control lines (Fig. 9.2).
Below the recommendation regarding the trend evaluation for results exceeding
the specified criteria are shown (Fig. 9.2).
A. One result beyond the action line (additional measurements should be made)
(Fig. 9.2a)
B. Nine consecutive results are on the same side of the center line (a systematic
error occurred) (Fig. 9.2b)
C. Six consecutive results constantly increasing or decreasing (trend occurs)
(Fig. 9.2c)
D. 14 consecutive results on both sides of the central line, of which the first five
and the last four were conducted by one analyst and the middle four by another
analyst (influence of the person who takes the measurements) (Fig. 9.2d)
E. Two out of four or three consecutive results are between the warning line and
the action line (Fig. 9.2e)
9 Managing the Quality Systems
X
+3SD
X
+2SD
X
+SD
X
-SD
X
-3SD
X
-2SD
X
(a)
(d)
(b)
(e)
(c)
(f)
The result of determination
Next measurement
X
+3SD
X
+2SD
X
+SD
X
-SD
X
-3SD
X
-2SD
X
The result of determination
Next measurement
X
+3SD
X
+2SD
X
+SD
X
-SD
X
-3SD
X
-2SD
X
The result of determination
Next measurement
X
+3SD
X
+2SD
X
+SD
X
-SD
X
-3SD
X
-2SD
X
The result of determination
Next measurement
X
+3SD
X
+2SD
X
+SD
X
-SD
X
-3SD
X
-2SD
X
The result of determination
Next measurement
X
+3SD
X
+2SD
X
+SD
X
-SD
X
-3SD
X
-2SD
X
The result of determination
Next measurement
Fig. 9.2 Example of the critical evaluation of control charts with troubleshot results
the central line, it is suspected that a systematic error occurred, which could mean
incorrect drawing of the central and control lines (Fig. 9.2).
Below the recommendation regarding the trend evaluation for results exceeding
the specified criteria are shown (Fig. 9.2).
A. One result beyond the action line (additional measurements should be made)
(Fig. 9.2a)
B. Nine consecutive results are on the same side of the center line (a systematic
error occurred) (Fig. 9.2b)
C. Six consecutive results constantly increasing or decreasing (trend occurs)
(Fig. 9.2c)
D. 14 consecutive results on both sides of the central line, of which the first five
and the last four were conducted by one analyst and the middle four by another
analyst (influence of the person who takes the measurements) (Fig. 9.2d)
E. Two out of four or three consecutive results are between the warning line and
the action line (Fig. 9.2e)