

144
8 Measurement Uncertainty
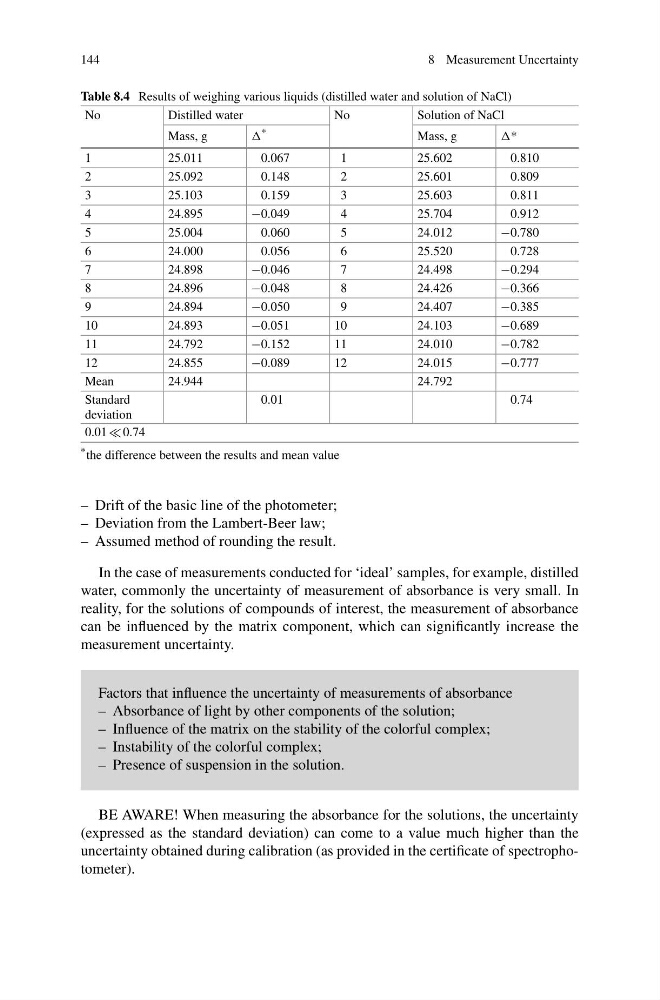
Table 8.4 Results of weighing various liquids (distilled water and solution of NaCl)
No
Distilled water
No
Solution of NaCl
Mass, g
*
Mass, g
*
1
25.011
0.067
1
25.602
0.810
2
25.092
0.148
2
25.601
0.809
3
25.103
0.159
3
25.603
0.811
4
24.895
−0.049
4
25.704
0.912
5
25.004
0.060
5
24.012
−0.780
6
24.000
0.056
6
25.520
0.728
7
24.898
−0.046
7
24.498
−0.294
8
24.896
−0.048
8
24.426
−0.366
9
24.894
−0.050
9
24.407
−0.385
10
24.893
−0.051
10
24.103
−0.689
11
24.792
−0.152
11
24.010
−0.782
12
24.855
−0.089
12
24.015
−0.777
Mean
24.944
24.792
Standard
deviation
0.01
0.74
0.01 0.74
* the difference between the results and mean value
– Drift of the basic line of the photometer;
– Deviation from the Lambert-Beer law;
– Assumed method of rounding the result.
In the case of measurements conducted for ‘ideal’ samples, for example, distilled
water, commonly the uncertainty of measurement of absorbance is very small. In
reality, for the solutions of compounds of interest, the measurement of absorbance
can be influenced by the matrix component, which can significantly increase the
measurement uncertainty.
Factors that influence the uncertainty of measurements of absorbance
– Absorbance of light by other components of the solution;
– Influence of the matrix on the stability of the colorful complex;
– Instability of the colorful complex;
– Presence of suspension in the solution.
BE AWARE! When measuring the absorbance for the solutions, the uncertainty
(expressed as the standard deviation) can come to a value much higher than the
uncertainty obtained during calibration (as provided in the certificate of spectrophotometer).
8 Measurement Uncertainty
Table 8.4 Results of weighing various liquids (distilled water and solution of NaCl)
No
Distilled water
No
Solution of NaCl
Mass, g
*
Mass, g
*
1
25.011
0.067
1
25.602
0.810
2
25.092
0.148
2
25.601
0.809
3
25.103
0.159
3
25.603
0.811
4
24.895
−0.049
4
25.704
0.912
5
25.004
0.060
5
24.012
−0.780
6
24.000
0.056
6
25.520
0.728
7
24.898
−0.046
7
24.498
−0.294
8
24.896
−0.048
8
24.426
−0.366
9
24.894
−0.050
9
24.407
−0.385
10
24.893
−0.051
10
24.103
−0.689
11
24.792
−0.152
11
24.010
−0.782
12
24.855
−0.089
12
24.015
−0.777
Mean
24.944
24.792
Standard
deviation
0.01
0.74
0.01 0.74
* the difference between the results and mean value
– Drift of the basic line of the photometer;
– Deviation from the Lambert-Beer law;
– Assumed method of rounding the result.
In the case of measurements conducted for ‘ideal’ samples, for example, distilled
water, commonly the uncertainty of measurement of absorbance is very small. In
reality, for the solutions of compounds of interest, the measurement of absorbance
can be influenced by the matrix component, which can significantly increase the
measurement uncertainty.
Factors that influence the uncertainty of measurements of absorbance
– Absorbance of light by other components of the solution;
– Influence of the matrix on the stability of the colorful complex;
– Instability of the colorful complex;
– Presence of suspension in the solution.
BE AWARE! When measuring the absorbance for the solutions, the uncertainty
(expressed as the standard deviation) can come to a value much higher than the
uncertainty obtained during calibration (as provided in the certificate of spectrophotometer).