

8.19 Evaluation of Uncertainty by Mathematical Model
143
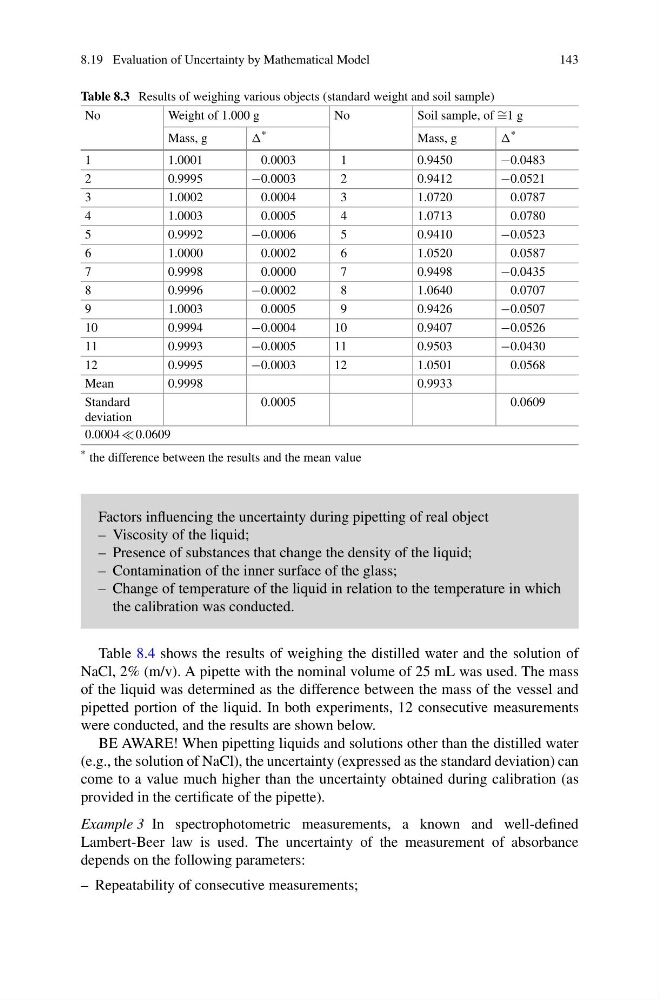
Table 8.3 Results of weighing various objects (standard weight and soil sample)
No
Weight of 1.000 g
No
Soil sample, of ∼ 1 g
Mass, g
*
Mass, g
*
1
1.0001
0.0003
1
0.9450
−0.0483
2
0.9995
−0.0003
2
0.9412
−0.0521
3
1.0002
0.0004
3
1.0720
0.0787
4
1.0003
0.0005
4
1.0713
0.0780
5
0.9992
−0.0006
5
0.9410
−0.0523
6
1.0000
0.0002
6
1.0520
0.0587
7
0.9998
0.0000
7
0.9498
−0.0435
8
0.9996
−0.0002
8
1.0640
0.0707
9
1.0003
0.0005
9
0.9426
−0.0507
10
0.9994
−0.0004
10
0.9407
−0.0526
11
0.9993
−0.0005
11
0.9503
−0.0430
12
0.9995
−0.0003
12
1.0501
0.0568
Mean
0.9998
0.9933
Standard
deviation
0.0005
0.0609
0.0004 0.0609
* the difference between the results and the mean value
Factors influencing the uncertainty during pipetting of real object
– Viscosity of the liquid;
– Presence of substances that change the density of the liquid;
– Contamination of the inner surface of the glass;
– Change of temperature of the liquid in relation to the temperature in which
the calibration was conducted.
Table 8.4 shows the results of weighing the distilled water and the solution of
NaCl, 2% (m/v). A pipette with the nominal volume of 25 mL was used. The mass
of the liquid was determined as the difference between the mass of the vessel and
pipetted portion of the liquid. In both experiments, 12 consecutive measurements
were conducted, and the results are shown below.
BE AWARE! When pipetting liquids and solutions other than the distilled water
(e.g., the solution of NaCl), the uncertainty (expressed as the standard deviation) can
come to a value much higher than the uncertainty obtained during calibration (as
provided in the certificate of the pipette).
Example 3 In spectrophotometric measurements, a known and well-defined
Lambert-Beer law is used. The uncertainty of the measurement of absorbance
depends on the following parameters:
– Repeatability of consecutive measurements;
143
Table 8.3 Results of weighing various objects (standard weight and soil sample)
No
Weight of 1.000 g
No
Soil sample, of ∼ 1 g
Mass, g
*
Mass, g
*
1
1.0001
0.0003
1
0.9450
−0.0483
2
0.9995
−0.0003
2
0.9412
−0.0521
3
1.0002
0.0004
3
1.0720
0.0787
4
1.0003
0.0005
4
1.0713
0.0780
5
0.9992
−0.0006
5
0.9410
−0.0523
6
1.0000
0.0002
6
1.0520
0.0587
7
0.9998
0.0000
7
0.9498
−0.0435
8
0.9996
−0.0002
8
1.0640
0.0707
9
1.0003
0.0005
9
0.9426
−0.0507
10
0.9994
−0.0004
10
0.9407
−0.0526
11
0.9993
−0.0005
11
0.9503
−0.0430
12
0.9995
−0.0003
12
1.0501
0.0568
Mean
0.9998
0.9933
Standard
deviation
0.0005
0.0609
0.0004 0.0609
* the difference between the results and the mean value
Factors influencing the uncertainty during pipetting of real object
– Viscosity of the liquid;
– Presence of substances that change the density of the liquid;
– Contamination of the inner surface of the glass;
– Change of temperature of the liquid in relation to the temperature in which
the calibration was conducted.
Table 8.4 shows the results of weighing the distilled water and the solution of
NaCl, 2% (m/v). A pipette with the nominal volume of 25 mL was used. The mass
of the liquid was determined as the difference between the mass of the vessel and
pipetted portion of the liquid. In both experiments, 12 consecutive measurements
were conducted, and the results are shown below.
BE AWARE! When pipetting liquids and solutions other than the distilled water
(e.g., the solution of NaCl), the uncertainty (expressed as the standard deviation) can
come to a value much higher than the uncertainty obtained during calibration (as
provided in the certificate of the pipette).
Example 3 In spectrophotometric measurements, a known and well-defined
Lambert-Beer law is used. The uncertainty of the measurement of absorbance
depends on the following parameters:
– Repeatability of consecutive measurements;