

8.3 Measurement Results
121
x
n
i1 x i
n
(8.3)
Standard deviation is the measure of the spread; and if we do not know the standard
deviation for a population, we calculate its estimator s from the test results.
For large but finite set of results (populations of results), the standard deviation is
calculated with an equation:
σ
n
i1 (x i − μ) 2
n
(8.4)
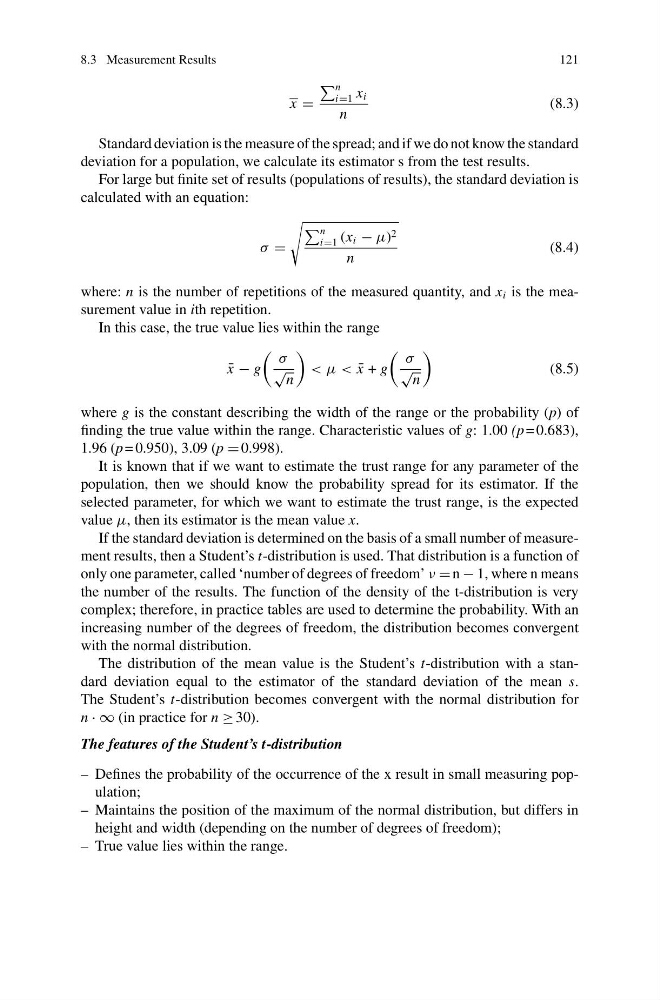
where: n is the number of repetitions of the measured quantity, and x i is the measurement value in ith repetition.
In this case, the true value lies within the range
¯
x − g
σ
√
n
< μ < ¯
x + g
σ
√
n
(8.5)
where g is the constant describing the width of the range or the probability (p) of
finding the true value within the range. Characteristic values of g: 1.00 (p = 0.683),
1.96 (p = 0.950), 3.09 (p 0.998).
It is known that if we want to estimate the trust range for any parameter of the
population, then we should know the probability spread for its estimator. If the
selected parameter, for which we want to estimate the trust range, is the expected
value μ, then its estimator is the mean value x.
If the standard deviation is determined on the basis of a small number of measurement results, then a Student’s t-distribution is used. That distribution is a function of
only one parameter, called ‘number of degrees of freedom’ ν n − 1, where n means
the number of the results. The function of the density of the t-distribution is very
complex; therefore, in practice tables are used to determine the probability. With an
increasing number of the degrees of freedom, the distribution becomes convergent
with the normal distribution.
The distribution of the mean value is the Student’s t-distribution with a standard deviation equal to the estimator of the standard deviation of the mean s.
The Student’s t-distribution becomes convergent with the normal distribution for
n · ∞ (in practice for n ≥ 30).
The features of the Student’s t-distribution
– Defines the probability of the occurrence of the x result in small measuring population;
– Maintains the position of the maximum of the normal distribution, but differs in
height and width (depending on the number of degrees of freedom);
– True value lies within the range.
121
x
n
i1 x i
n
(8.3)
Standard deviation is the measure of the spread; and if we do not know the standard
deviation for a population, we calculate its estimator s from the test results.
For large but finite set of results (populations of results), the standard deviation is
calculated with an equation:
σ
n
i1 (x i − μ) 2
n
(8.4)
where: n is the number of repetitions of the measured quantity, and x i is the measurement value in ith repetition.
In this case, the true value lies within the range
¯
x − g
σ
√
n
< μ < ¯
x + g
σ
√
n
(8.5)
where g is the constant describing the width of the range or the probability (p) of
finding the true value within the range. Characteristic values of g: 1.00 (p = 0.683),
1.96 (p = 0.950), 3.09 (p 0.998).
It is known that if we want to estimate the trust range for any parameter of the
population, then we should know the probability spread for its estimator. If the
selected parameter, for which we want to estimate the trust range, is the expected
value μ, then its estimator is the mean value x.
If the standard deviation is determined on the basis of a small number of measurement results, then a Student’s t-distribution is used. That distribution is a function of
only one parameter, called ‘number of degrees of freedom’ ν n − 1, where n means
the number of the results. The function of the density of the t-distribution is very
complex; therefore, in practice tables are used to determine the probability. With an
increasing number of the degrees of freedom, the distribution becomes convergent
with the normal distribution.
The distribution of the mean value is the Student’s t-distribution with a standard deviation equal to the estimator of the standard deviation of the mean s.
The Student’s t-distribution becomes convergent with the normal distribution for
n · ∞ (in practice for n ≥ 30).
The features of the Student’s t-distribution
– Defines the probability of the occurrence of the x result in small measuring population;
– Maintains the position of the maximum of the normal distribution, but differs in
height and width (depending on the number of degrees of freedom);
– True value lies within the range.