

108
7 Validation of the Measurement Procedure
Table 7.9 Example calculations of the accuracy and precision for one standard solution of known
concentration of 1.30 mg/L
Measurement’s result, mg/L
Difference ()
2
1.23
−0.07
0.0049
1.21
−0.09
0.0081
1.30
0.00
0.0000
1.59
0.29
0.0841
1.57
0.27
0.0729
1.21
−0.09
0.0081
1.53
0.23
0.0529
1.25
−0.05
0.0025
Mean 1.36
0.49
0.2335
different concentrations and for test samples be performed, respectively. It is recommended that one of the standard solutions should be close but above the detection
limit, whereas the second should be close but below the upper concentration within
the linear range of calibration. Depending on the calibration dynamic range, those
two standards will cover the whole range or the middle concentration should be also
added. The test samples are used to examine the precision of measurements in the
presence of the matrix. Due to the statistical requirements, it is recommended that
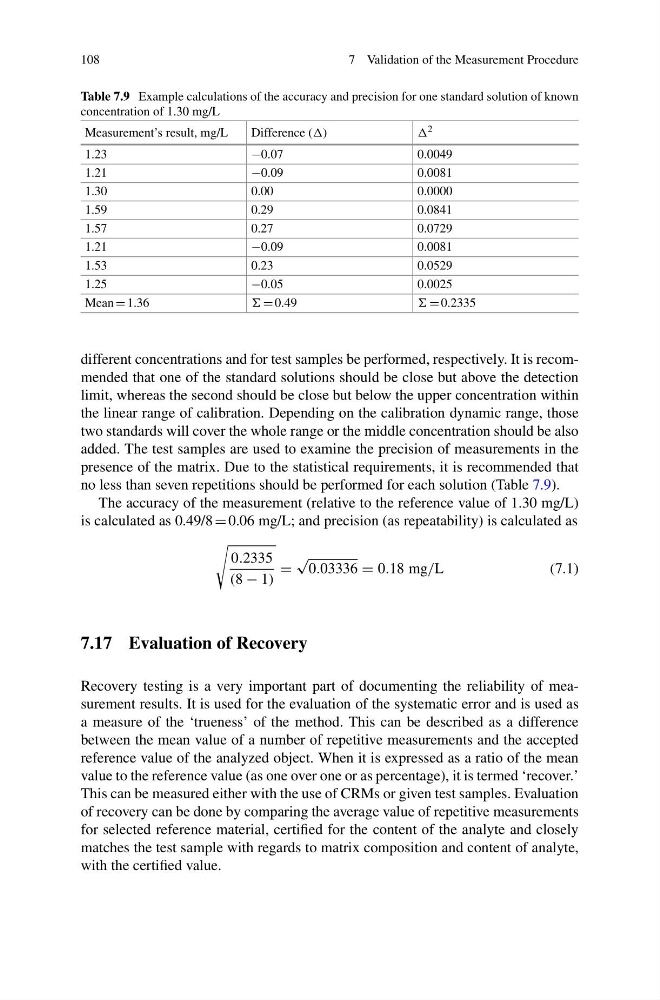
no less than seven repetitions should be performed for each solution (Table 7.9).
The accuracy of the measurement (relative to the reference value of 1.30 mg/L)
is calculated as 0.49/8 0.06 mg/L; and precision (as repeatability) is calculated as
0.2335
(8 − 1)
√
0.03336 0.18 mg/L
(7.1)
7.17 Evaluation of Recovery
Recovery testing is a very important part of documenting the reliability of measurement results. It is used for the evaluation of the systematic error and is used as
a measure of the ‘trueness’ of the method. This can be described as a difference
between the mean value of a number of repetitive measurements and the accepted
reference value of the analyzed object. When it is expressed as a ratio of the mean
value to the reference value (as one over one or as percentage), it is termed ‘recover.’
This can be measured either with the use of CRMs or given test samples. Evaluation
of recovery can be done by comparing the average value of repetitive measurements
for selected reference material, certified for the content of the analyte and closely
matches the test sample with regards to matrix composition and content of analyte,
with the certified value.
7 Validation of the Measurement Procedure
Table 7.9 Example calculations of the accuracy and precision for one standard solution of known
concentration of 1.30 mg/L
Measurement’s result, mg/L
Difference ()
2
1.23
−0.07
0.0049
1.21
−0.09
0.0081
1.30
0.00
0.0000
1.59
0.29
0.0841
1.57
0.27
0.0729
1.21
−0.09
0.0081
1.53
0.23
0.0529
1.25
−0.05
0.0025
Mean 1.36
0.49
0.2335
different concentrations and for test samples be performed, respectively. It is recommended that one of the standard solutions should be close but above the detection
limit, whereas the second should be close but below the upper concentration within
the linear range of calibration. Depending on the calibration dynamic range, those
two standards will cover the whole range or the middle concentration should be also
added. The test samples are used to examine the precision of measurements in the
presence of the matrix. Due to the statistical requirements, it is recommended that
no less than seven repetitions should be performed for each solution (Table 7.9).
The accuracy of the measurement (relative to the reference value of 1.30 mg/L)
is calculated as 0.49/8 0.06 mg/L; and precision (as repeatability) is calculated as
0.2335
(8 − 1)
√
0.03336 0.18 mg/L
(7.1)
7.17 Evaluation of Recovery
Recovery testing is a very important part of documenting the reliability of measurement results. It is used for the evaluation of the systematic error and is used as
a measure of the ‘trueness’ of the method. This can be described as a difference
between the mean value of a number of repetitive measurements and the accepted
reference value of the analyzed object. When it is expressed as a ratio of the mean
value to the reference value (as one over one or as percentage), it is termed ‘recover.’
This can be measured either with the use of CRMs or given test samples. Evaluation
of recovery can be done by comparing the average value of repetitive measurements
for selected reference material, certified for the content of the analyte and closely
matches the test sample with regards to matrix composition and content of analyte,
with the certified value.