

108
7 Time-Ordered or Goldstone Diagrams
where the overall sign (−1)
s still needs to be fixed. Note that the factor
1
2
accounts
for the pair of equivalent particle lines (a, b) according to the Abrikosov rule (A5).
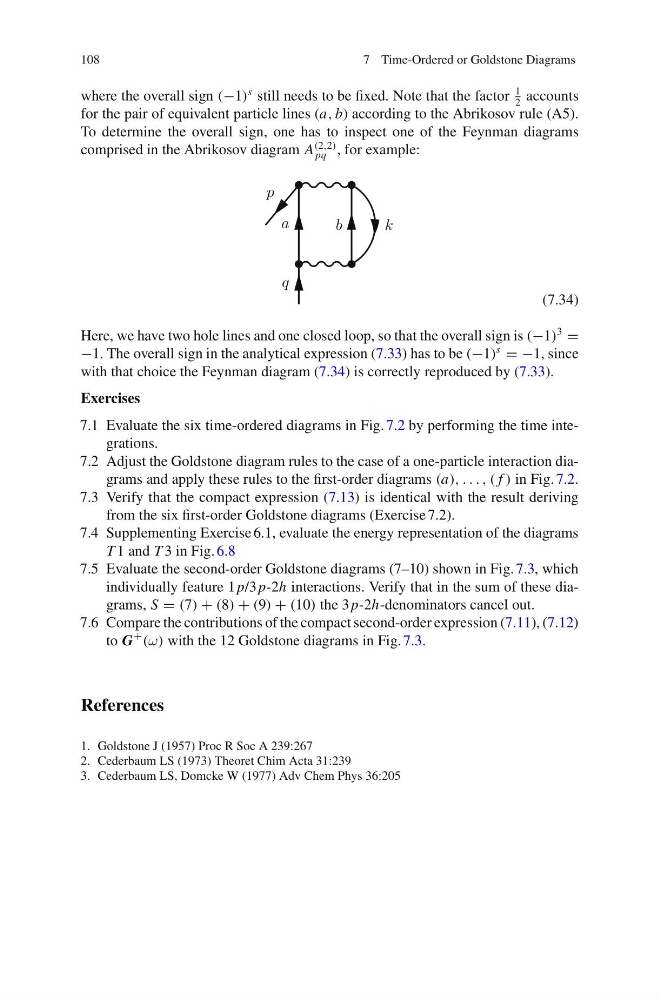
To determine the overall sign, one has to inspect one of the Feynman diagrams
comprised in the Abrikosov diagram A
(2,2)
pq , for example:
p
k
a
b
q
(7.34)
Here, we have two hole lines and one closed loop, so that the overall sign is (−1)
3
=
−1. The overall sign in the analytical expression (7.33) has to be (−1)
s
= −1, since
with that choice the Feynman diagram (7.34) is correctly reproduced by (7.33).
Exercises
7.1 Evaluate the six time-ordered diagrams in Fig. 7.2 by performing the time integrations.
7.2 Adjust the Goldstone diagram rules to the case of a one-particle interaction diagrams and apply these rules to the first-order diagrams (a), . . . , ( f ) in Fig. 7.2.
7.3 Verify that the compact expression (7.13) is identical with the result deriving
from the six first-order Goldstone diagrams (Exercise 7.2).
7.4 Supplementing Exercise 6.1, evaluate the energy representation of the diagrams
T 1 and T 3 in Fig. 6.8
7.5 Evaluate the second-order Goldstone diagrams (7–10) shown in Fig. 7.3, which
individually feature 1 p/3 p-2h interactions. Verify that in the sum of these diagrams, S = (7) + (8) + (9) + (10) the 3 p-2h-denominators cancel out.
7.6 Compare the contributions of the compact second-order expression (7.11), (7.12)
to G
+
(ω) with the 12 Goldstone diagrams in Fig. 7.3.
References
1. Goldstone J (1957) Proc R Soc A 239:267
2. Cederbaum LS (1973) Theoret Chim Acta 31:239
3. Cederbaum LS, Domcke W (1977) Adv Chem Phys 36:205
7 Time-Ordered or Goldstone Diagrams
where the overall sign (−1)
s still needs to be fixed. Note that the factor
1
2
accounts
for the pair of equivalent particle lines (a, b) according to the Abrikosov rule (A5).
To determine the overall sign, one has to inspect one of the Feynman diagrams
comprised in the Abrikosov diagram A
(2,2)
pq , for example:
p
k
a
b
q
(7.34)
Here, we have two hole lines and one closed loop, so that the overall sign is (−1)
3
=
−1. The overall sign in the analytical expression (7.33) has to be (−1)
s
= −1, since
with that choice the Feynman diagram (7.34) is correctly reproduced by (7.33).
Exercises
7.1 Evaluate the six time-ordered diagrams in Fig. 7.2 by performing the time integrations.
7.2 Adjust the Goldstone diagram rules to the case of a one-particle interaction diagrams and apply these rules to the first-order diagrams (a), . . . , ( f ) in Fig. 7.2.
7.3 Verify that the compact expression (7.13) is identical with the result deriving
from the six first-order Goldstone diagrams (Exercise 7.2).
7.4 Supplementing Exercise 6.1, evaluate the energy representation of the diagrams
T 1 and T 3 in Fig. 6.8
7.5 Evaluate the second-order Goldstone diagrams (7–10) shown in Fig. 7.3, which
individually feature 1 p/3 p-2h interactions. Verify that in the sum of these diagrams, S = (7) + (8) + (9) + (10) the 3 p-2h-denominators cancel out.
7.6 Compare the contributions of the compact second-order expression (7.11), (7.12)
to G
+
(ω) with the 12 Goldstone diagrams in Fig. 7.3.
References
1. Goldstone J (1957) Proc R Soc A 239:267
2. Cederbaum LS (1973) Theoret Chim Acta 31:239
3. Cederbaum LS, Domcke W (1977) Adv Chem Phys 36:205