

formula of which is Ag 0.907 V 1.016 O 3 . Electron tomography analysis was conducted
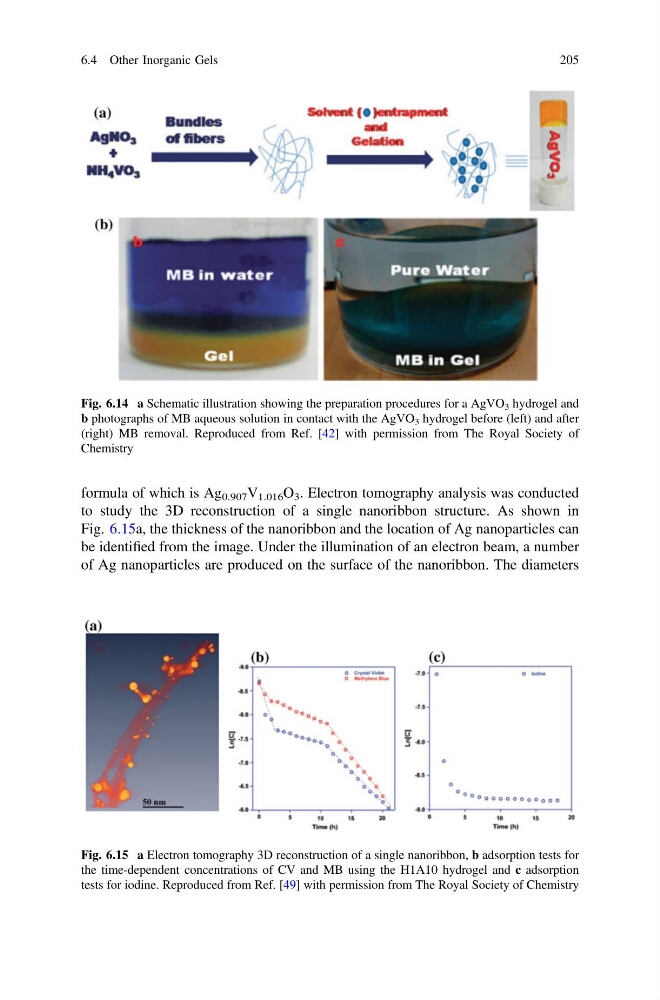
to study the 3D reconstruction of a single nanoribbon structure. As shown in
Fig. 6.15a, the thickness of the nanoribbon and the location of Ag nanoparticles can
be identified from the image. Under the illumination of an electron beam, a number
of Ag nanoparticles are produced on the surface of the nanoribbon. The diameters
Fig. 6.14 a Schematic illustration showing the preparation procedures for a AgVO 3 hydrogel and
b photographs of MB aqueous solution in contact with the AgVO 3 hydrogel before (left) and after
(right) MB removal. Reproduced from Ref. [42] with permission from The Royal Society of
Chemistry
Fig. 6.15 a Electron tomography 3D reconstruction of a single nanoribbon, b adsorption tests for
the time-dependent concentrations of CV and MB using the H1A10 hydrogel and c adsorption
tests for iodine. Reproduced from Ref. [49] with permission from The Royal Society of Chemistry
6.4 Other Inorganic Gels
205
to study the 3D reconstruction of a single nanoribbon structure. As shown in
Fig. 6.15a, the thickness of the nanoribbon and the location of Ag nanoparticles can
be identified from the image. Under the illumination of an electron beam, a number
of Ag nanoparticles are produced on the surface of the nanoribbon. The diameters
Fig. 6.14 a Schematic illustration showing the preparation procedures for a AgVO 3 hydrogel and
b photographs of MB aqueous solution in contact with the AgVO 3 hydrogel before (left) and after
(right) MB removal. Reproduced from Ref. [42] with permission from The Royal Society of
Chemistry
Fig. 6.15 a Electron tomography 3D reconstruction of a single nanoribbon, b adsorption tests for
the time-dependent concentrations of CV and MB using the H1A10 hydrogel and c adsorption
tests for iodine. Reproduced from Ref. [49] with permission from The Royal Society of Chemistry
6.4 Other Inorganic Gels
205