

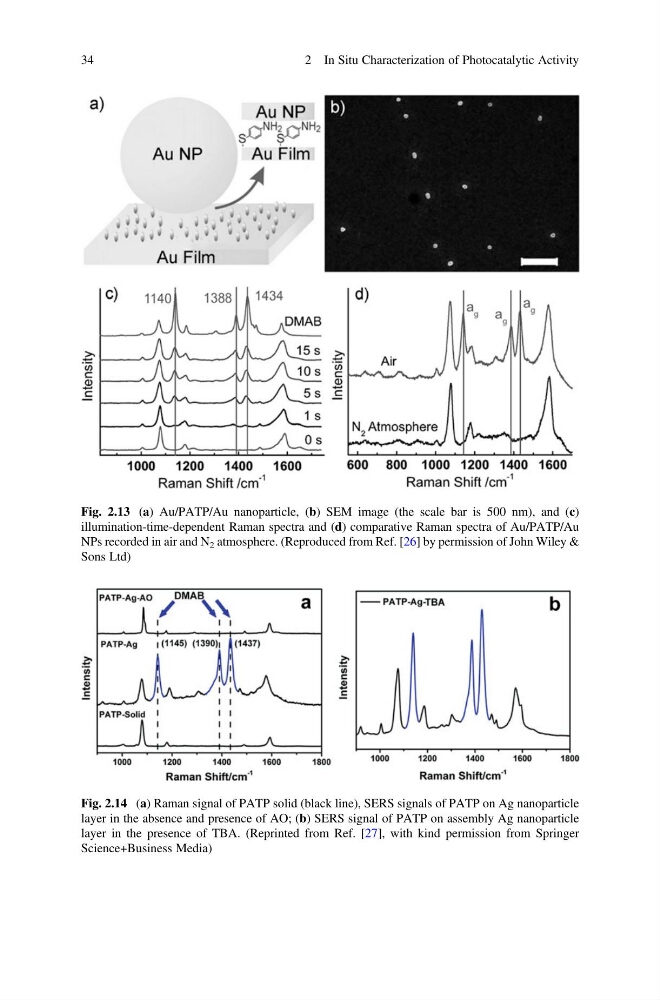
Fig. 2.13 (a) Au/PATP/Au nanoparticle, (b) SEM image (the scale bar is 500 nm), and (c)
illumination-time-dependent Raman spectra and (d) comparative Raman spectra of Au/PATP/Au
NPs recorded in air and N 2 atmosphere. (Reproduced from Ref. [26] by permission of John Wiley &
Sons Ltd)
Fig. 2.14 (a) Raman signal of PATP solid (black line), SERS signals of PATP on Ag nanoparticle
layer in the absence and presence of AO; (b) SERS signal of PATP on assembly Ag nanoparticle
layer in the presence of TBA. (Reprinted from Ref. [27], with kind permission from Springer
Science+Business Media)
34
2 In Situ Characterization of Photocatalytic Activity
illumination-time-dependent Raman spectra and (d) comparative Raman spectra of Au/PATP/Au
NPs recorded in air and N 2 atmosphere. (Reproduced from Ref. [26] by permission of John Wiley &
Sons Ltd)
Fig. 2.14 (a) Raman signal of PATP solid (black line), SERS signals of PATP on Ag nanoparticle
layer in the absence and presence of AO; (b) SERS signal of PATP on assembly Ag nanoparticle
layer in the presence of TBA. (Reprinted from Ref. [27], with kind permission from Springer
Science+Business Media)
34
2 In Situ Characterization of Photocatalytic Activity