

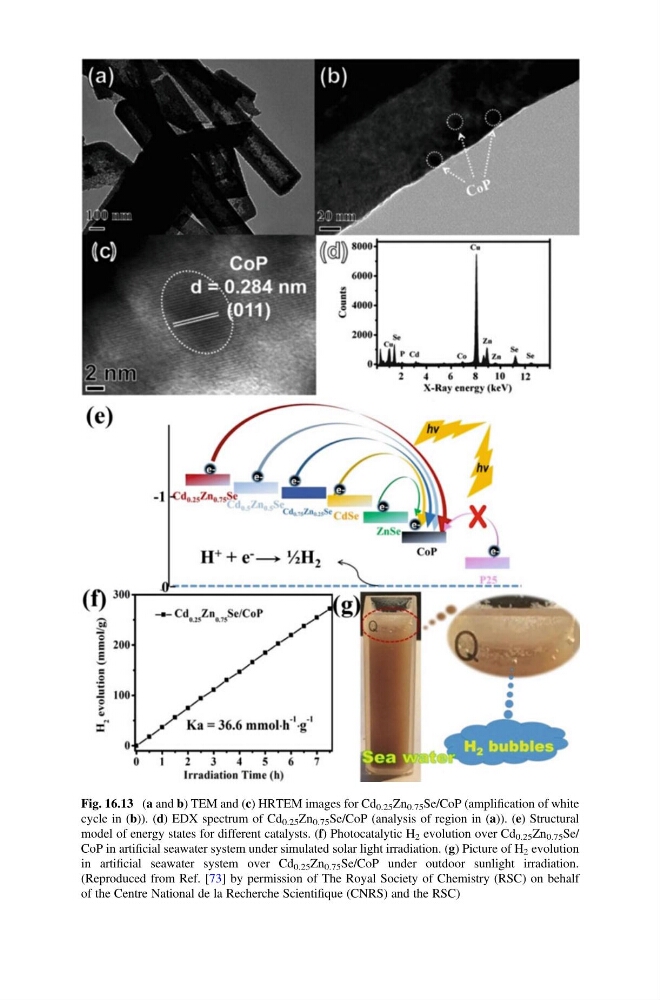
Fig. 16.13 (a and b) TEM and (c) HRTEM images for Cd 0.25 Zn 0.75 Se/CoP (amplification of white
cycle in (b)). (d) EDX spectrum of Cd 0.25 Zn 0.75 Se/CoP (analysis of region in (a)). (e) Structural
model of energy states for different catalysts. (f) Photocatalytic H 2 evolution over Cd 0.25 Zn 0.75 Se/
CoP in artificial seawater system under simulated solar light irradiation. (g) Picture of H 2 evolution
in artificial seawater system over Cd 0.25 Zn 0.75 Se/CoP under outdoor sunlight irradiation.
(Reproduced from Ref. [73] by permission of The Royal Society of Chemistry (RSC) on behalf
of the Centre National de la Recherche Scientifique (CNRS) and the RSC)
cycle in (b)). (d) EDX spectrum of Cd 0.25 Zn 0.75 Se/CoP (analysis of region in (a)). (e) Structural
model of energy states for different catalysts. (f) Photocatalytic H 2 evolution over Cd 0.25 Zn 0.75 Se/
CoP in artificial seawater system under simulated solar light irradiation. (g) Picture of H 2 evolution
in artificial seawater system over Cd 0.25 Zn 0.75 Se/CoP under outdoor sunlight irradiation.
(Reproduced from Ref. [73] by permission of The Royal Society of Chemistry (RSC) on behalf
of the Centre National de la Recherche Scientifique (CNRS) and the RSC)