

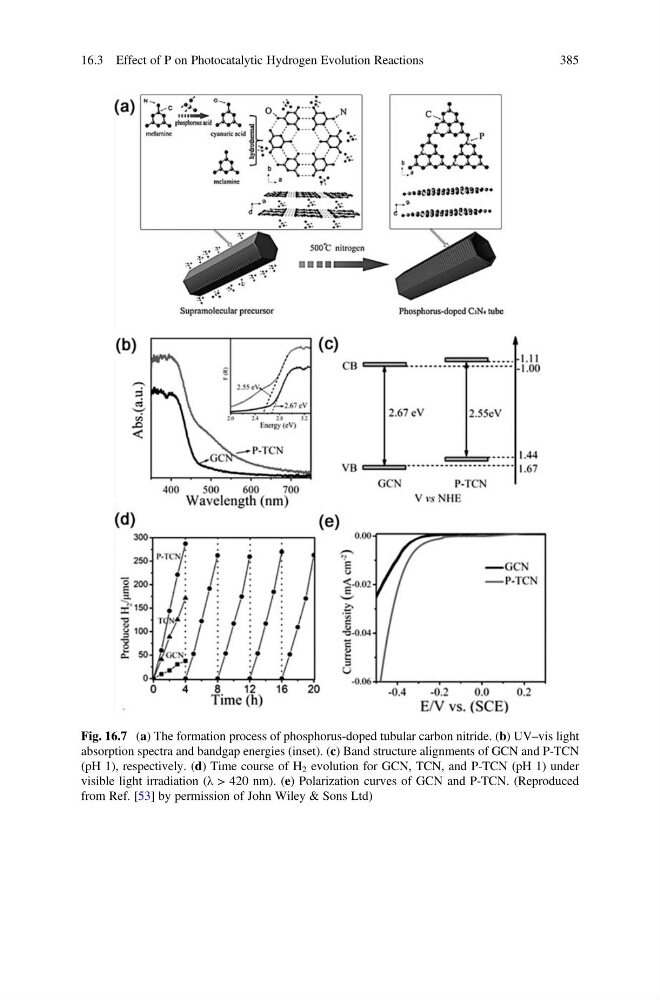
Fig. 16.7 (a) The formation process of phosphorus-doped tubular carbon nitride. (b) UV–vis light
absorption spectra and bandgap energies (inset). (c) Band structure alignments of GCN and P-TCN
(pH 1), respectively. (d) Time course of H 2 evolution for GCN, TCN, and P-TCN (pH 1) under
visible light irradiation (λ > 420 nm). (e) Polarization curves of GCN and P-TCN. (Reproduced
from Ref. [53] by permission of John Wiley & Sons Ltd)
16.3 Effect of P on Photocatalytic Hydrogen Evolution Reactions
385
absorption spectra and bandgap energies (inset). (c) Band structure alignments of GCN and P-TCN
(pH 1), respectively. (d) Time course of H 2 evolution for GCN, TCN, and P-TCN (pH 1) under
visible light irradiation (λ > 420 nm). (e) Polarization curves of GCN and P-TCN. (Reproduced
from Ref. [53] by permission of John Wiley & Sons Ltd)
16.3 Effect of P on Photocatalytic Hydrogen Evolution Reactions
385