

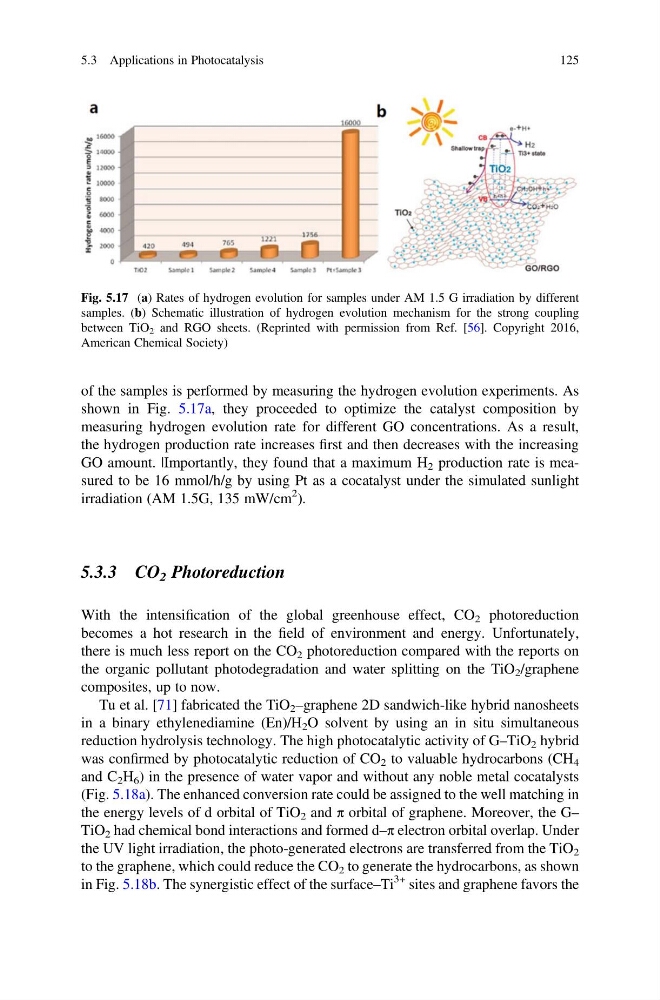
of the samples is performed by measuring the hydrogen evolution experiments. As
shown in Fig. 5.17a, they proceeded to optimize the catalyst composition by
measuring hydrogen evolution rate for different GO concentrations. As a result,
the hydrogen production rate increases first and then decreases with the increasing
GO amount. |Importantly, they found that a maximum H 2 production rate is measured to be 16 mmol/h/g by using Pt as a cocatalyst under the simulated sunlight
irradiation (AM 1.5G, 135 mW/cm
2 ).
5.3.3 CO 2 Photoreduction
With the intensification of the global greenhouse effect, CO 2 photoreduction
becomes a hot research in the field of environment and energy. Unfortunately,
there is much less report on the CO 2 photoreduction compared with the reports on
the organic pollutant photodegradation and water splitting on the TiO 2 /graphene
composites, up to now.
Tu et al. [71] fabricated the TiO 2 –graphene 2D sandwich-like hybrid nanosheets
in a binary ethylenediamine (En)/H 2 O solvent by using an in situ simultaneous
reduction hydrolysis technology. The high photocatalytic activity of G–TiO 2 hybrid
was confirmed by photocatalytic reduction of CO 2 to valuable hydrocarbons (CH 4
and C 2 H 6 ) in the presence of water vapor and without any noble metal cocatalysts
(Fig. 5.18a). The enhanced conversion rate could be assigned to the well matching in
the energy levels of d orbital of TiO 2 and π orbital of graphene. Moreover, the G–
TiO 2 had chemical bond interactions and formed d–π electron orbital overlap. Under
the UV light irradiation, the photo-generated electrons are transferred from the TiO 2
to the graphene, which could reduce the CO 2 to generate the hydrocarbons, as shown
in Fig. 5.18b. The synergistic effect of the surface–Ti
3+ sites and graphene favors the
Fig. 5.17 (a) Rates of hydrogen evolution for samples under AM 1.5 G irradiation by different
samples. (b) Schematic illustration of hydrogen evolution mechanism for the strong coupling
between TiO 2 and RGO sheets. (Reprinted with permission from Ref. [56]. Copyright 2016,
American Chemical Society)
5.3 Applications in Photocatalysis
125
shown in Fig. 5.17a, they proceeded to optimize the catalyst composition by
measuring hydrogen evolution rate for different GO concentrations. As a result,
the hydrogen production rate increases first and then decreases with the increasing
GO amount. |Importantly, they found that a maximum H 2 production rate is measured to be 16 mmol/h/g by using Pt as a cocatalyst under the simulated sunlight
irradiation (AM 1.5G, 135 mW/cm
2 ).
5.3.3 CO 2 Photoreduction
With the intensification of the global greenhouse effect, CO 2 photoreduction
becomes a hot research in the field of environment and energy. Unfortunately,
there is much less report on the CO 2 photoreduction compared with the reports on
the organic pollutant photodegradation and water splitting on the TiO 2 /graphene
composites, up to now.
Tu et al. [71] fabricated the TiO 2 –graphene 2D sandwich-like hybrid nanosheets
in a binary ethylenediamine (En)/H 2 O solvent by using an in situ simultaneous
reduction hydrolysis technology. The high photocatalytic activity of G–TiO 2 hybrid
was confirmed by photocatalytic reduction of CO 2 to valuable hydrocarbons (CH 4
and C 2 H 6 ) in the presence of water vapor and without any noble metal cocatalysts
(Fig. 5.18a). The enhanced conversion rate could be assigned to the well matching in
the energy levels of d orbital of TiO 2 and π orbital of graphene. Moreover, the G–
TiO 2 had chemical bond interactions and formed d–π electron orbital overlap. Under
the UV light irradiation, the photo-generated electrons are transferred from the TiO 2
to the graphene, which could reduce the CO 2 to generate the hydrocarbons, as shown
in Fig. 5.18b. The synergistic effect of the surface–Ti
3+ sites and graphene favors the
Fig. 5.17 (a) Rates of hydrogen evolution for samples under AM 1.5 G irradiation by different
samples. (b) Schematic illustration of hydrogen evolution mechanism for the strong coupling
between TiO 2 and RGO sheets. (Reprinted with permission from Ref. [56]. Copyright 2016,
American Chemical Society)
5.3 Applications in Photocatalysis
125