

covalent bond as represented by the protocovalent bond or the single V(N) attractor.
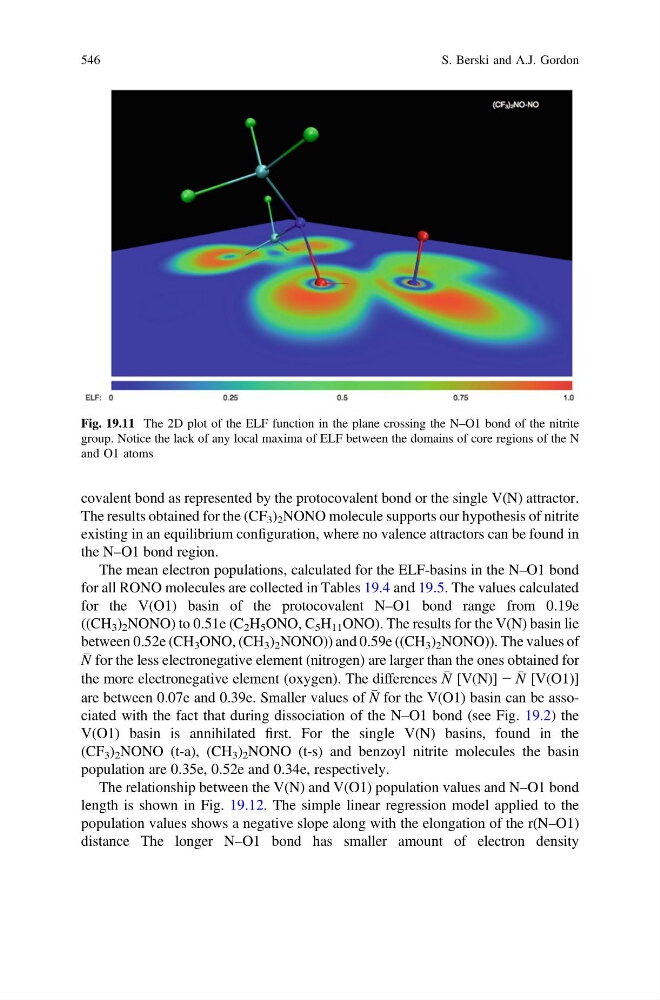
The results obtained for the (CF 3 ) 2 NONO molecule supports our hypothesis of nitrite
existing in an equilibrium configuration, where no valence attractors can be found in
the N–O1 bond region.
The mean electron populations, calculated for the ELF-basins in the N–O1 bond
for all RONO molecules are collected in Tables 19.4 and 19.5. The values calculated
for the V(O1) basin of the protocovalent N–O1 bond range from 0.19e
((CH 3 ) 2 NONO) to 0.51e (C 2 H 5 ONO, C 5 H 11 ONO). The results for the V(N) basin lie
between 0.52e (CH 3 ONO, (CH 3 ) 2 NONO)) and 0.59e ((CH 3 ) 2 NONO)). The values of
N for the less electronegative element (nitrogen) are larger than the ones obtained for
the more electronegative element (oxygen). The differences
N [V(N)] −
N [V(O1)]
are between 0.07e and 0.39e. Smaller values of
N for the V(O1) basin can be associated with the fact that during dissociation of the N–O1 bond (see Fig. 19.2) the
V(O1) basin is annihilated first. For the single V(N) basins, found in the
(CF 3 ) 2 NONO (t-a), (CH 3 ) 2 NONO (t-s) and benzoyl nitrite molecules the basin
population are 0.35e, 0.52e and 0.34e, respectively.
The relationship between the V(N) and V(O1) population values and N–O1 bond
length is shown in Fig. 19.12. The simple linear regression model applied to the
population values shows a negative slope along with the elongation of the r(N–O1)
distance The longer N–O1 bond has smaller amount of electron density
Fig. 19.11 The 2D plot of the ELF function in the plane crossing the N–O1 bond of the nitrite
group. Notice the lack of any local maxima of ELF between the domains of core regions of the N
and O1 atoms
546
S. Berski and A.J. Gordon
The results obtained for the (CF 3 ) 2 NONO molecule supports our hypothesis of nitrite
existing in an equilibrium configuration, where no valence attractors can be found in
the N–O1 bond region.
The mean electron populations, calculated for the ELF-basins in the N–O1 bond
for all RONO molecules are collected in Tables 19.4 and 19.5. The values calculated
for the V(O1) basin of the protocovalent N–O1 bond range from 0.19e
((CH 3 ) 2 NONO) to 0.51e (C 2 H 5 ONO, C 5 H 11 ONO). The results for the V(N) basin lie
between 0.52e (CH 3 ONO, (CH 3 ) 2 NONO)) and 0.59e ((CH 3 ) 2 NONO)). The values of
N for the less electronegative element (nitrogen) are larger than the ones obtained for
the more electronegative element (oxygen). The differences
N [V(N)] −
N [V(O1)]
are between 0.07e and 0.39e. Smaller values of
N for the V(O1) basin can be associated with the fact that during dissociation of the N–O1 bond (see Fig. 19.2) the
V(O1) basin is annihilated first. For the single V(N) basins, found in the
(CF 3 ) 2 NONO (t-a), (CH 3 ) 2 NONO (t-s) and benzoyl nitrite molecules the basin
population are 0.35e, 0.52e and 0.34e, respectively.
The relationship between the V(N) and V(O1) population values and N–O1 bond
length is shown in Fig. 19.12. The simple linear regression model applied to the
population values shows a negative slope along with the elongation of the r(N–O1)
distance The longer N–O1 bond has smaller amount of electron density
Fig. 19.11 The 2D plot of the ELF function in the plane crossing the N–O1 bond of the nitrite
group. Notice the lack of any local maxima of ELF between the domains of core regions of the N
and O1 atoms
546
S. Berski and A.J. Gordon