

toward), and the N lone pair overlaps with the lobe of the P–H σ* orbital that is
closest to the P. The calculated binding energy of this pnictogen-bonded complex is
larger than the one of the hydrogen-bonded complex that is formed between the
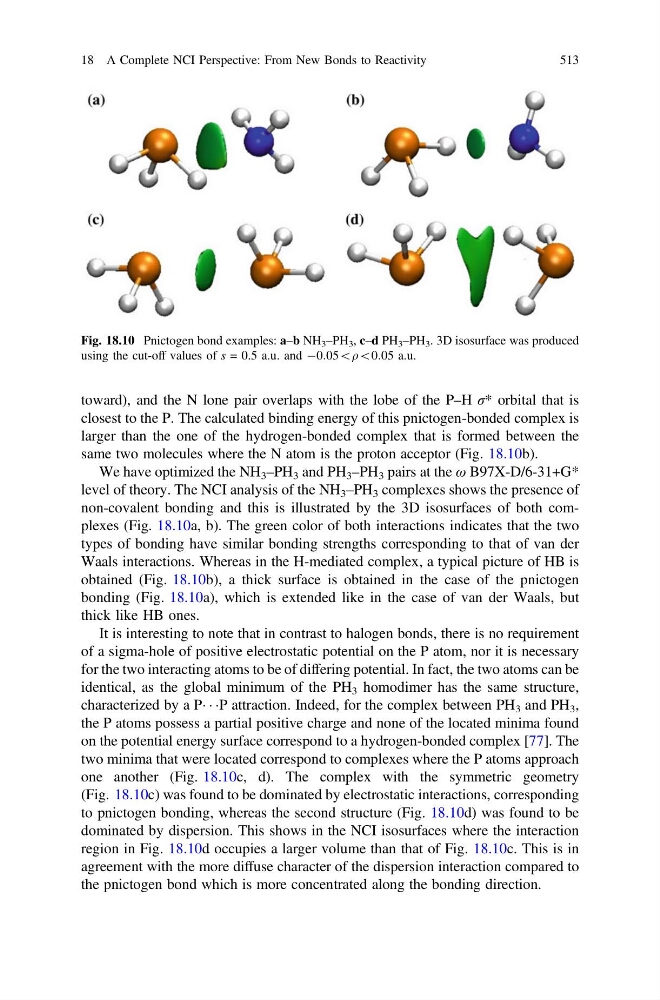
same two molecules where the N atom is the proton acceptor (Fig. 18.10b).
We have optimized the NH 3 –PH 3 and PH 3 –PH 3 pairs at the ω B97X-D/6-31+G*
level of theory. The NCI analysis of the NH 3 –PH 3 complexes shows the presence of
non-covalent bonding and this is illustrated by the 3D isosurfaces of both complexes (Fig. 18.10a, b). The green color of both interactions indicates that the two
types of bonding have similar bonding strengths corresponding to that of van der
Waals interactions. Whereas in the H-mediated complex, a typical picture of HB is
obtained (Fig. 18.10b), a thick surface is obtained in the case of the pnictogen
bonding (Fig. 18.10a), which is extended like in the case of van der Waals, but
thick like HB ones.
It is interesting to note that in contrast to halogen bonds, there is no requirement
of a sigma-hole of positive electrostatic potential on the P atom, nor it is necessary
for the two interacting atoms to be of differing potential. In fact, the two atoms can be
identical, as the global minimum of the PH 3 homodimer has the same structure,
characterized by a PÁ Á ÁP attraction. Indeed, for the complex between PH 3 and PH 3 ,
the P atoms possess a partial positive charge and none of the located minima found
on the potential energy surface correspond to a hydrogen-bonded complex [77]. The
two minima that were located correspond to complexes where the P atoms approach
one another (Fig. 18.10c, d). The complex with the symmetric geometry
(Fig. 18.10c) was found to be dominated by electrostatic interactions, corresponding
to pnictogen bonding, whereas the second structure (Fig. 18.10d) was found to be
dominated by dispersion. This shows in the NCI isosurfaces where the interaction
region in Fig. 18.10d occupies a larger volume than that of Fig. 18.10c. This is in
agreement with the more diffuse character of the dispersion interaction compared to
the pnictogen bond which is more concentrated along the bonding direction.
Fig. 18.10 Pnictogen bond examples: a–b NH 3 –PH 3 , c–d PH 3 –PH 3 . 3D isosurface was produced
using the cut-off values of s = 0.5 a.u. and À0:05\q\0:05 a.u.
18 A Complete NCI Perspective: From New Bonds to Reactivity
513
closest to the P. The calculated binding energy of this pnictogen-bonded complex is
larger than the one of the hydrogen-bonded complex that is formed between the
same two molecules where the N atom is the proton acceptor (Fig. 18.10b).
We have optimized the NH 3 –PH 3 and PH 3 –PH 3 pairs at the ω B97X-D/6-31+G*
level of theory. The NCI analysis of the NH 3 –PH 3 complexes shows the presence of
non-covalent bonding and this is illustrated by the 3D isosurfaces of both complexes (Fig. 18.10a, b). The green color of both interactions indicates that the two
types of bonding have similar bonding strengths corresponding to that of van der
Waals interactions. Whereas in the H-mediated complex, a typical picture of HB is
obtained (Fig. 18.10b), a thick surface is obtained in the case of the pnictogen
bonding (Fig. 18.10a), which is extended like in the case of van der Waals, but
thick like HB ones.
It is interesting to note that in contrast to halogen bonds, there is no requirement
of a sigma-hole of positive electrostatic potential on the P atom, nor it is necessary
for the two interacting atoms to be of differing potential. In fact, the two atoms can be
identical, as the global minimum of the PH 3 homodimer has the same structure,
characterized by a PÁ Á ÁP attraction. Indeed, for the complex between PH 3 and PH 3 ,
the P atoms possess a partial positive charge and none of the located minima found
on the potential energy surface correspond to a hydrogen-bonded complex [77]. The
two minima that were located correspond to complexes where the P atoms approach
one another (Fig. 18.10c, d). The complex with the symmetric geometry
(Fig. 18.10c) was found to be dominated by electrostatic interactions, corresponding
to pnictogen bonding, whereas the second structure (Fig. 18.10d) was found to be
dominated by dispersion. This shows in the NCI isosurfaces where the interaction
region in Fig. 18.10d occupies a larger volume than that of Fig. 18.10c. This is in
agreement with the more diffuse character of the dispersion interaction compared to
the pnictogen bond which is more concentrated along the bonding direction.
Fig. 18.10 Pnictogen bond examples: a–b NH 3 –PH 3 , c–d PH 3 –PH 3 . 3D isosurface was produced
using the cut-off values of s = 0.5 a.u. and À0:05\q\0:05 a.u.
18 A Complete NCI Perspective: From New Bonds to Reactivity
513