

large densities and small density gradients. The lower bound on the reduced density
gradient is zero, as occurs throughout a homogeneous electron gas and at BCPs.
The effect of bonding on the reduced density gradient is especially easy to
visualize when s is plotted as a function of the density. When ρ is given by a single
Slater Type Orbital (STO), graphs of s(ρ) assume the form f(x) = ax
−1/3 , where a is
a constant (see Appendix, Table 18.2). This can easily be proven from a Slater
Type Orbital (STO) model density. For a single atomic orbital ψ = e
−αr , the density
is ρ = e
−2αr and the gradient is ∇ρ = −2αρ, such that
sðqÞ ¼
1
C S
2aq
q 4=3 ¼
2a
C S
q
À1=3
:
ð18:3Þ
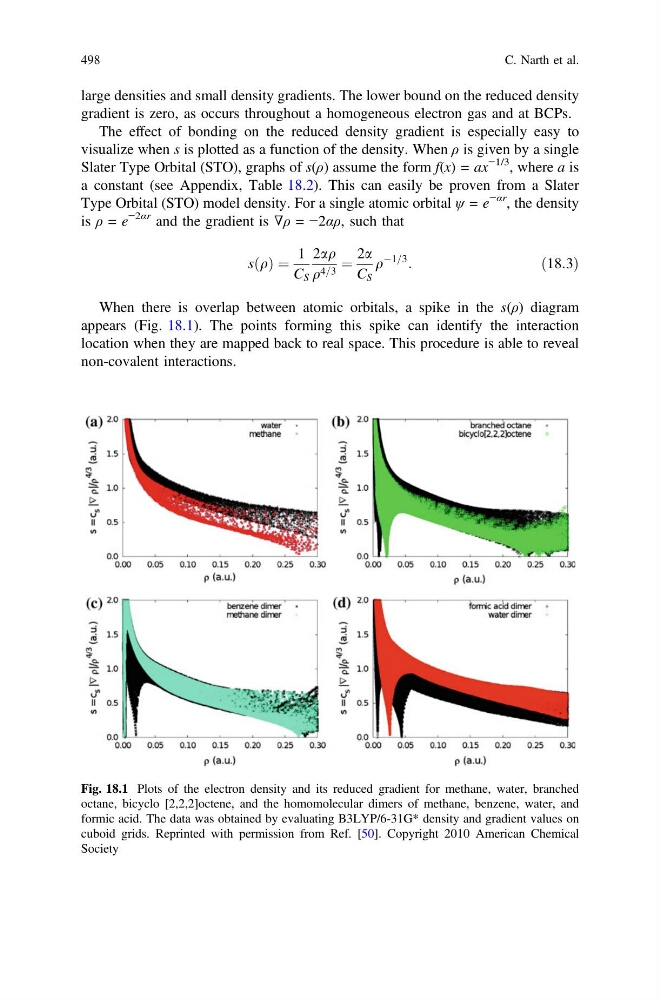
When there is overlap between atomic orbitals, a spike in the s(ρ) diagram
appears (Fig. 18.1). The points forming this spike can identify the interaction
location when they are mapped back to real space. This procedure is able to reveal
non-covalent interactions.
Fig. 18.1 Plots of the electron density and its reduced gradient for methane, water, branched
octane, bicyclo [2,2,2]octene, and the homomolecular dimers of methane, benzene, water, and
formic acid. The data was obtained by evaluating B3LYP/6-31G* density and gradient values on
cuboid grids. Reprinted with permission from Ref. [50]. Copyright 2010 American Chemical
Society
498
C. Narth et al.
gradient is zero, as occurs throughout a homogeneous electron gas and at BCPs.
The effect of bonding on the reduced density gradient is especially easy to
visualize when s is plotted as a function of the density. When ρ is given by a single
Slater Type Orbital (STO), graphs of s(ρ) assume the form f(x) = ax
−1/3 , where a is
a constant (see Appendix, Table 18.2). This can easily be proven from a Slater
Type Orbital (STO) model density. For a single atomic orbital ψ = e
−αr , the density
is ρ = e
−2αr and the gradient is ∇ρ = −2αρ, such that
sðqÞ ¼
1
C S
2aq
q 4=3 ¼
2a
C S
q
À1=3
:
ð18:3Þ
When there is overlap between atomic orbitals, a spike in the s(ρ) diagram
appears (Fig. 18.1). The points forming this spike can identify the interaction
location when they are mapped back to real space. This procedure is able to reveal
non-covalent interactions.
Fig. 18.1 Plots of the electron density and its reduced gradient for methane, water, branched
octane, bicyclo [2,2,2]octene, and the homomolecular dimers of methane, benzene, water, and
formic acid. The data was obtained by evaluating B3LYP/6-31G* density and gradient values on
cuboid grids. Reprinted with permission from Ref. [50]. Copyright 2010 American Chemical
Society
498
C. Narth et al.