

from the σ bonding orbitals (Be–H bond) to the empty orbitals of the Lewis base of
suitable symmetry. The A2 component does not represents any important
contribution.
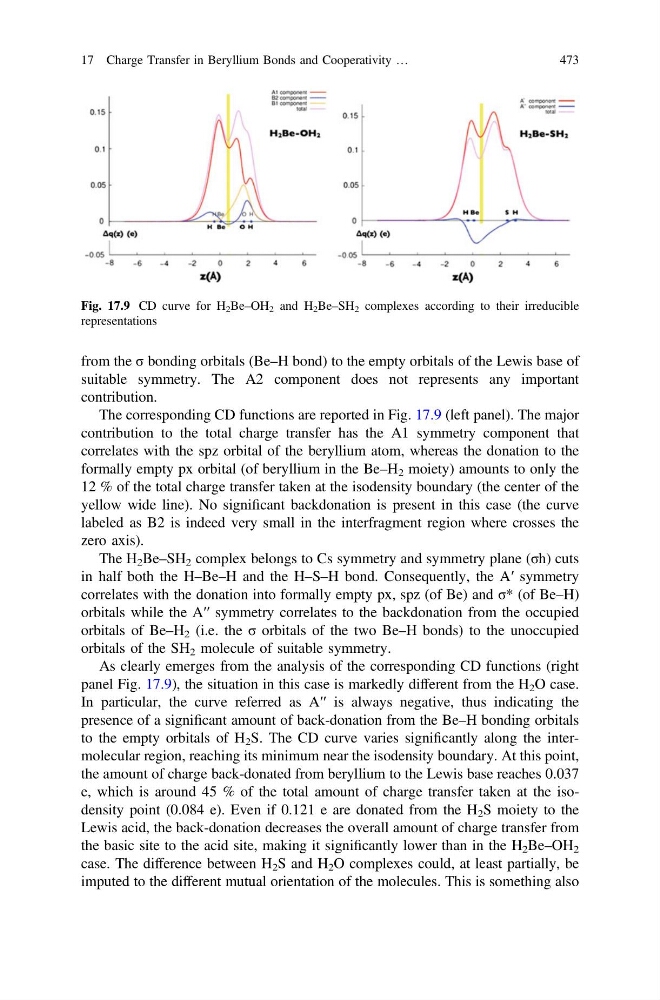
The corresponding CD functions are reported in Fig. 17.9 (left panel). The major
contribution to the total charge transfer has the A1 symmetry component that
correlates with the spz orbital of the beryllium atom, whereas the donation to the
formally empty px orbital (of beryllium in the Be–H 2 moiety) amounts to only the
12 % of the total charge transfer taken at the isodensity boundary (the center of the
yellow wide line). No significant backdonation is present in this case (the curve
labeled as B2 is indeed very small in the interfragment region where crosses the
zero axis).
The H 2 Be–SH 2 complex belongs to Cs symmetry and symmetry plane (σh) cuts
in half both the H–Be–H and the H–S–H bond. Consequently, the A′ symmetry
correlates with the donation into formally empty px, spz (of Be) and σ* (of Be–H)
orbitals while the A′′ symmetry correlates to the backdonation from the occupied
orbitals of Be–H 2 (i.e. the σ orbitals of the two Be–H bonds) to the unoccupied
orbitals of the SH 2 molecule of suitable symmetry.
As clearly emerges from the analysis of the corresponding CD functions (right
panel Fig. 17.9), the situation in this case is markedly different from the H 2 O case.
In particular, the curve referred as A′′ is always negative, thus indicating the
presence of a significant amount of back-donation from the Be–H bonding orbitals
to the empty orbitals of H 2 S. The CD curve varies significantly along the intermolecular region, reaching its minimum near the isodensity boundary. At this point,
the amount of charge back-donated from beryllium to the Lewis base reaches 0.037
e, which is around 45 % of the total amount of charge transfer taken at the isodensity point (0.084 e). Even if 0.121 e are donated from the H 2 S moiety to the
Lewis acid, the back-donation decreases the overall amount of charge transfer from
the basic site to the acid site, making it significantly lower than in the H 2 Be–OH 2
case. The difference between H 2 S and H 2 O complexes could, at least partially, be
imputed to the different mutual orientation of the molecules. This is something also
Fig. 17.9 CD curve for H 2 Be–OH 2 and H 2 Be–SH 2 complexes according to their irreducible
representations
17 Charge Transfer in Beryllium Bonds and Cooperativity …
473
suitable symmetry. The A2 component does not represents any important
contribution.
The corresponding CD functions are reported in Fig. 17.9 (left panel). The major
contribution to the total charge transfer has the A1 symmetry component that
correlates with the spz orbital of the beryllium atom, whereas the donation to the
formally empty px orbital (of beryllium in the Be–H 2 moiety) amounts to only the
12 % of the total charge transfer taken at the isodensity boundary (the center of the
yellow wide line). No significant backdonation is present in this case (the curve
labeled as B2 is indeed very small in the interfragment region where crosses the
zero axis).
The H 2 Be–SH 2 complex belongs to Cs symmetry and symmetry plane (σh) cuts
in half both the H–Be–H and the H–S–H bond. Consequently, the A′ symmetry
correlates with the donation into formally empty px, spz (of Be) and σ* (of Be–H)
orbitals while the A′′ symmetry correlates to the backdonation from the occupied
orbitals of Be–H 2 (i.e. the σ orbitals of the two Be–H bonds) to the unoccupied
orbitals of the SH 2 molecule of suitable symmetry.
As clearly emerges from the analysis of the corresponding CD functions (right
panel Fig. 17.9), the situation in this case is markedly different from the H 2 O case.
In particular, the curve referred as A′′ is always negative, thus indicating the
presence of a significant amount of back-donation from the Be–H bonding orbitals
to the empty orbitals of H 2 S. The CD curve varies significantly along the intermolecular region, reaching its minimum near the isodensity boundary. At this point,
the amount of charge back-donated from beryllium to the Lewis base reaches 0.037
e, which is around 45 % of the total amount of charge transfer taken at the isodensity point (0.084 e). Even if 0.121 e are donated from the H 2 S moiety to the
Lewis acid, the back-donation decreases the overall amount of charge transfer from
the basic site to the acid site, making it significantly lower than in the H 2 Be–OH 2
case. The difference between H 2 S and H 2 O complexes could, at least partially, be
imputed to the different mutual orientation of the molecules. This is something also
Fig. 17.9 CD curve for H 2 Be–OH 2 and H 2 Be–SH 2 complexes according to their irreducible
representations
17 Charge Transfer in Beryllium Bonds and Cooperativity …
473