

former one is stronger than the latter one what means that the P center is more
acidic in the PFH 2 moiety than in the P(OH)H 2 one.
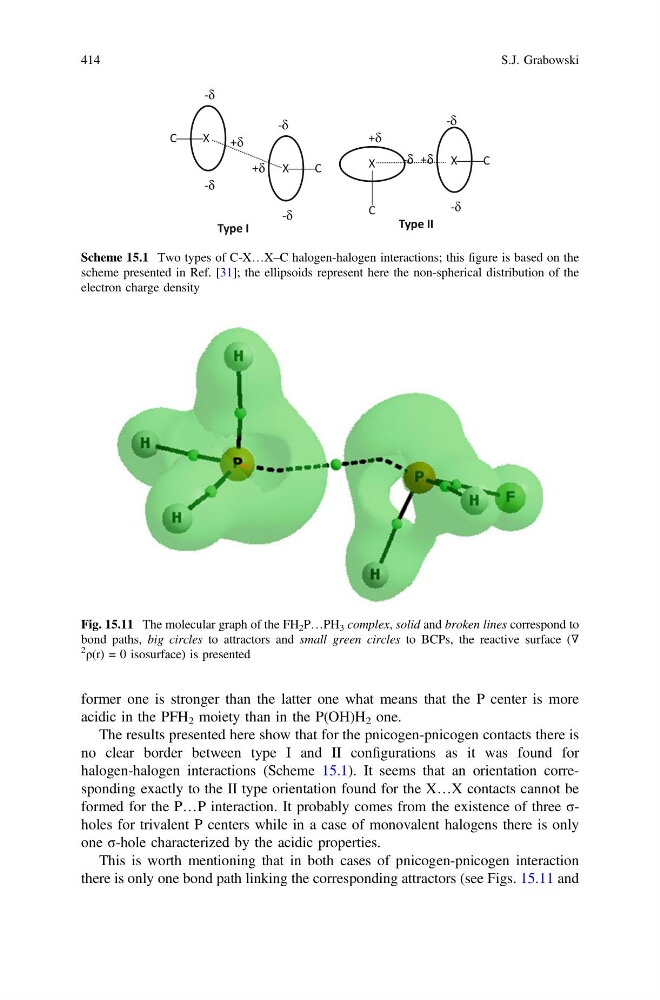
The results presented here show that for the pnicogen-pnicogen contacts there is
no clear border between type I and II configurations as it was found for
halogen-halogen interactions (Scheme 15.1). It seems that an orientation corresponding exactly to the II type orientation found for the X…X contacts cannot be
formed for the P…P interaction. It probably comes from the existence of three σholes for trivalent P centers while in a case of monovalent halogens there is only
one σ-hole characterized by the acidic properties.
This is worth mentioning that in both cases of pnicogen-pnicogen interaction
there is only one bond path linking the corresponding attractors (see Figs. 15.11 and
Scheme 15.1 Two types of C-X…X–C halogen-halogen interactions; this figure is based on the
scheme presented in Ref. [31]; the ellipsoids represent here the non-spherical distribution of the
electron charge density
Fig. 15.11 The molecular graph of the FH 2 P…PH 3 complex, solid and broken lines correspond to
bond paths, big circles to attractors and small green circles to BCPs, the reactive surface (∇
2
ρ(r) = 0 isosurface) is presented
414
S.J. Grabowski
acidic in the PFH 2 moiety than in the P(OH)H 2 one.
The results presented here show that for the pnicogen-pnicogen contacts there is
no clear border between type I and II configurations as it was found for
halogen-halogen interactions (Scheme 15.1). It seems that an orientation corresponding exactly to the II type orientation found for the X…X contacts cannot be
formed for the P…P interaction. It probably comes from the existence of three σholes for trivalent P centers while in a case of monovalent halogens there is only
one σ-hole characterized by the acidic properties.
This is worth mentioning that in both cases of pnicogen-pnicogen interaction
there is only one bond path linking the corresponding attractors (see Figs. 15.11 and
Scheme 15.1 Two types of C-X…X–C halogen-halogen interactions; this figure is based on the
scheme presented in Ref. [31]; the ellipsoids represent here the non-spherical distribution of the
electron charge density
Fig. 15.11 The molecular graph of the FH 2 P…PH 3 complex, solid and broken lines correspond to
bond paths, big circles to attractors and small green circles to BCPs, the reactive surface (∇
2
ρ(r) = 0 isosurface) is presented
414
S.J. Grabowski