

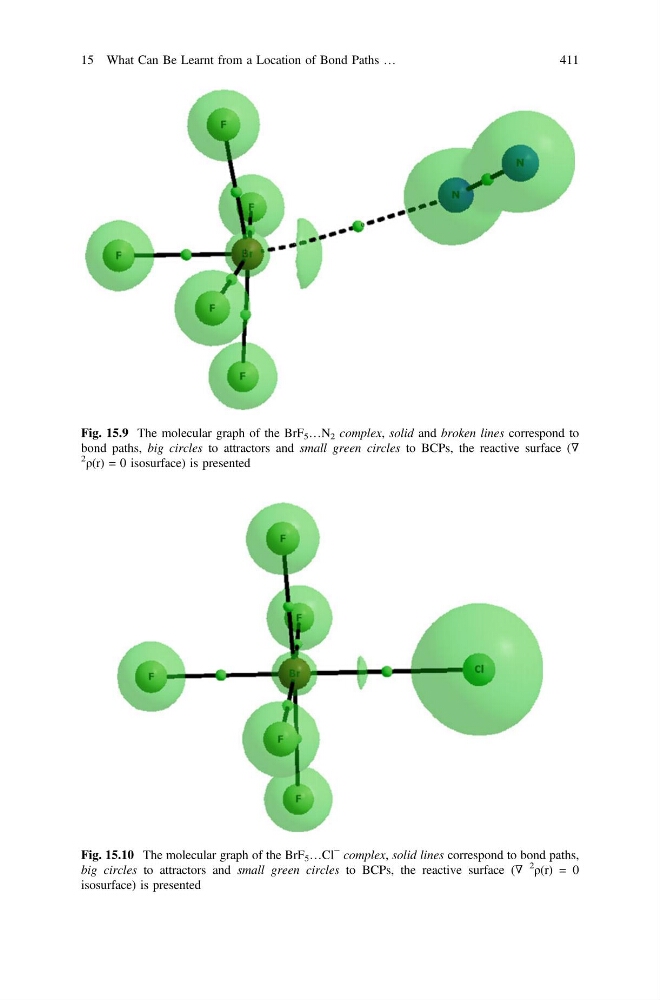
Fig. 15.9 The molecular graph of the BrF 5 …N 2 complex, solid and broken lines correspond to
bond paths, big circles to attractors and small green circles to BCPs, the reactive surface (∇
2
ρ(r) = 0 isosurface) is presented
Fig. 15.10 The molecular graph of the BrF 5 …Cl
− complex, solid lines correspond to bond paths,
big circles to attractors and small green circles to BCPs, the reactive surface (∇
2
ρ(r) = 0
isosurface) is presented
15 What Can Be Learnt from a Location of Bond Paths …
411
bond paths, big circles to attractors and small green circles to BCPs, the reactive surface (∇
2
ρ(r) = 0 isosurface) is presented
Fig. 15.10 The molecular graph of the BrF 5 …Cl
− complex, solid lines correspond to bond paths,
big circles to attractors and small green circles to BCPs, the reactive surface (∇
2
ρ(r) = 0
isosurface) is presented
15 What Can Be Learnt from a Location of Bond Paths …
411