

concentration of the electron charge density around chlorine for the HCCCl
molecule, with its “thin” concentration in the elongation of C–Cl bond and wider
concentration in the direction perpendicular to this bond; the latter corresponds to
the lone unshared electron pairs. In a case of HCCBr molecule there is no the
concentration of the electron density in the C–Br bond line! This is why the more
positive EP is observed for the bromine derivative of acetylene than for the chlorine
derivative.
In a case of halogen bond the monovalent halogen center is usually analyzed
while there are only few studies on that kind of interaction with multivalent halogen
atoms. One can mention the study on Ph 2 IX complexes with XF 3 (X = Cl, Br, I)
[35] or the study where the complexes of XF 3 are compared with their XF analogues (X = Br or Cl) [36]. Very recently the complexes of BrF 3 and BrF 5 with N 2
and HCN species acting as Lewis bases were analyzed [37]. The situation for the
bromine center in BrF 3 and BrF 5 is different than in a case of monovalent halogens.
First of all, the whole hemispheres of multivalent bromines are characterized by the
positive electrostatic potential. It means that bromine should play the role of the
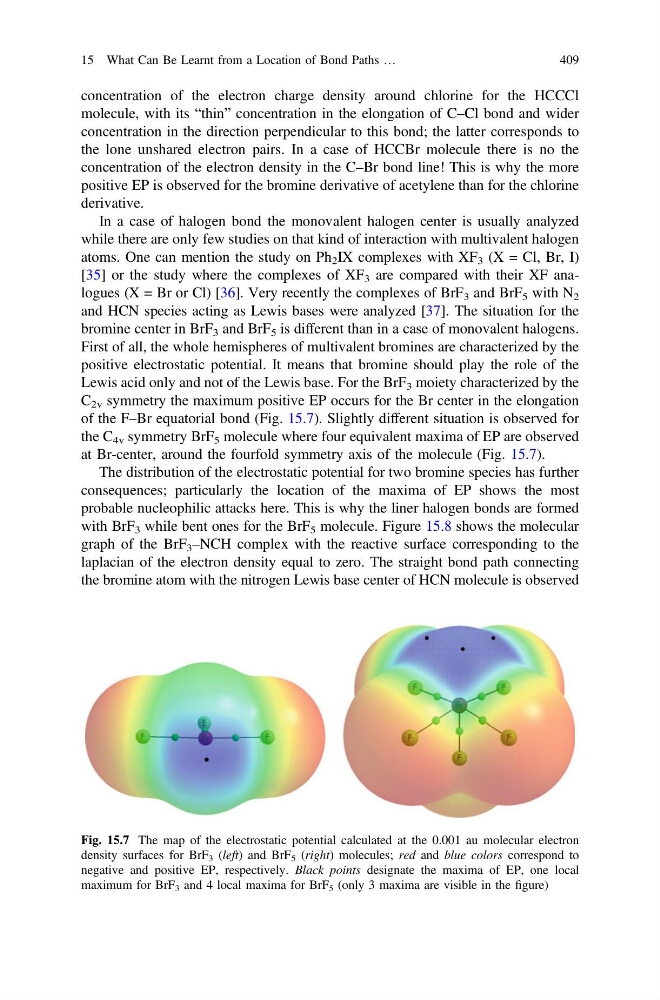
Lewis acid only and not of the Lewis base. For the BrF 3 moiety characterized by the
C 2v symmetry the maximum positive EP occurs for the Br center in the elongation
of the F–Br equatorial bond (Fig. 15.7). Slightly different situation is observed for
the C 4v symmetry BrF 5 molecule where four equivalent maxima of EP are observed
at Br-center, around the fourfold symmetry axis of the molecule (Fig. 15.7).
The distribution of the electrostatic potential for two bromine species has further
consequences; particularly the location of the maxima of EP shows the most
probable nucleophilic attacks here. This is why the liner halogen bonds are formed
with BrF 3 while bent ones for the BrF 5 molecule. Figure 15.8 shows the molecular
graph of the BrF 3 –NCH complex with the reactive surface corresponding to the
laplacian of the electron density equal to zero. The straight bond path connecting
the bromine atom with the nitrogen Lewis base center of HCN molecule is observed
Fig. 15.7 The map of the electrostatic potential calculated at the 0.001 au molecular electron
density surfaces for BrF 3 (left) and BrF 5 (right) molecules; red and blue colors correspond to
negative and positive EP, respectively. Black points designate the maxima of EP, one local
maximum for BrF 3 and 4 local maxima for BrF 5 (only 3 maxima are visible in the figure)
15 What Can Be Learnt from a Location of Bond Paths …
409
molecule, with its “thin” concentration in the elongation of C–Cl bond and wider
concentration in the direction perpendicular to this bond; the latter corresponds to
the lone unshared electron pairs. In a case of HCCBr molecule there is no the
concentration of the electron density in the C–Br bond line! This is why the more
positive EP is observed for the bromine derivative of acetylene than for the chlorine
derivative.
In a case of halogen bond the monovalent halogen center is usually analyzed
while there are only few studies on that kind of interaction with multivalent halogen
atoms. One can mention the study on Ph 2 IX complexes with XF 3 (X = Cl, Br, I)
[35] or the study where the complexes of XF 3 are compared with their XF analogues (X = Br or Cl) [36]. Very recently the complexes of BrF 3 and BrF 5 with N 2
and HCN species acting as Lewis bases were analyzed [37]. The situation for the
bromine center in BrF 3 and BrF 5 is different than in a case of monovalent halogens.
First of all, the whole hemispheres of multivalent bromines are characterized by the
positive electrostatic potential. It means that bromine should play the role of the
Lewis acid only and not of the Lewis base. For the BrF 3 moiety characterized by the
C 2v symmetry the maximum positive EP occurs for the Br center in the elongation
of the F–Br equatorial bond (Fig. 15.7). Slightly different situation is observed for
the C 4v symmetry BrF 5 molecule where four equivalent maxima of EP are observed
at Br-center, around the fourfold symmetry axis of the molecule (Fig. 15.7).
The distribution of the electrostatic potential for two bromine species has further
consequences; particularly the location of the maxima of EP shows the most
probable nucleophilic attacks here. This is why the liner halogen bonds are formed
with BrF 3 while bent ones for the BrF 5 molecule. Figure 15.8 shows the molecular
graph of the BrF 3 –NCH complex with the reactive surface corresponding to the
laplacian of the electron density equal to zero. The straight bond path connecting
the bromine atom with the nitrogen Lewis base center of HCN molecule is observed
Fig. 15.7 The map of the electrostatic potential calculated at the 0.001 au molecular electron
density surfaces for BrF 3 (left) and BrF 5 (right) molecules; red and blue colors correspond to
negative and positive EP, respectively. Black points designate the maxima of EP, one local
maximum for BrF 3 and 4 local maxima for BrF 5 (only 3 maxima are visible in the figure)
15 What Can Be Learnt from a Location of Bond Paths …
409