

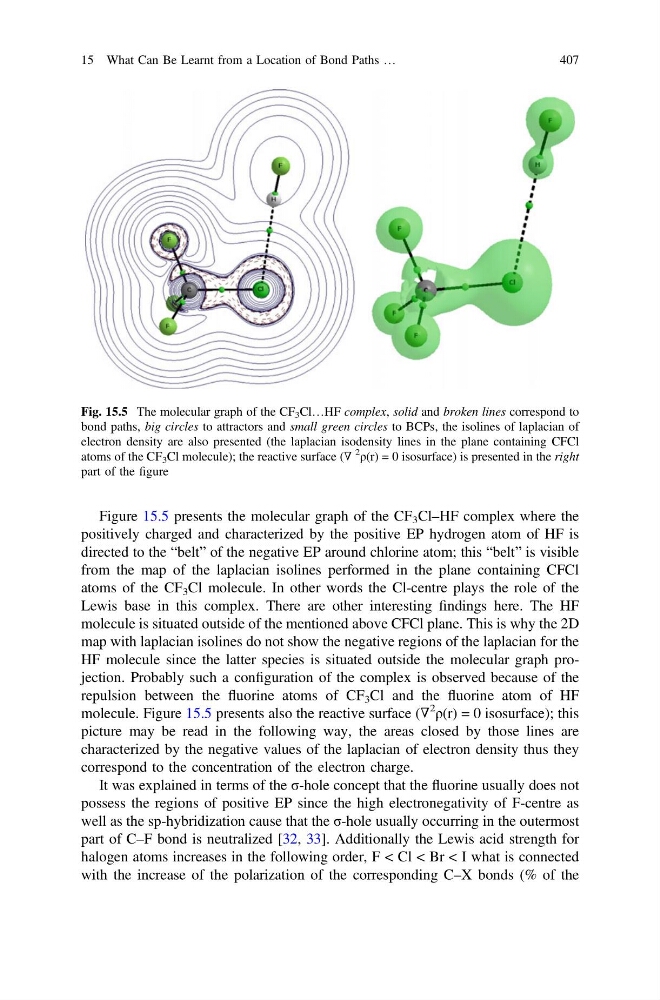
Figure 15.5 presents the molecular graph of the CF 3 Cl–HF complex where the
positively charged and characterized by the positive EP hydrogen atom of HF is
directed to the “belt” of the negative EP around chlorine atom; this “belt” is visible
from the map of the laplacian isolines performed in the plane containing CFCl
atoms of the CF 3 Cl molecule. In other words the Cl-centre plays the role of the
Lewis base in this complex. There are other interesting findings here. The HF
molecule is situated outside of the mentioned above CFCl plane. This is why the 2D
map with laplacian isolines do not show the negative regions of the laplacian for the
HF molecule since the latter species is situated outside the molecular graph projection. Probably such a configuration of the complex is observed because of the
repulsion between the fluorine atoms of CF 3 Cl and the fluorine atom of HF
molecule. Figure 15.5 presents also the reactive surface (∇
2
ρ(r) = 0 isosurface); this
picture may be read in the following way, the areas closed by those lines are
characterized by the negative values of the laplacian of electron density thus they
correspond to the concentration of the electron charge.
It was explained in terms of the σ-hole concept that the fluorine usually does not
possess the regions of positive EP since the high electronegativity of F-centre as
well as the sp-hybridization cause that the σ-hole usually occurring in the outermost
part of C–F bond is neutralized [32, 33]. Additionally the Lewis acid strength for
halogen atoms increases in the following order, F < Cl < Br < I what is connected
with the increase of the polarization of the corresponding C–X bonds (% of the
Fig. 15.5 The molecular graph of the CF 3 Cl…HF complex, solid and broken lines correspond to
bond paths, big circles to attractors and small green circles to BCPs, the isolines of laplacian of
electron density are also presented (the laplacian isodensity lines in the plane containing CFCl
atoms of the CF 3 Cl molecule); the reactive surface (∇
2
ρ(r) = 0 isosurface) is presented in the right
part of the figure
15 What Can Be Learnt from a Location of Bond Paths …
407
positively charged and characterized by the positive EP hydrogen atom of HF is
directed to the “belt” of the negative EP around chlorine atom; this “belt” is visible
from the map of the laplacian isolines performed in the plane containing CFCl
atoms of the CF 3 Cl molecule. In other words the Cl-centre plays the role of the
Lewis base in this complex. There are other interesting findings here. The HF
molecule is situated outside of the mentioned above CFCl plane. This is why the 2D
map with laplacian isolines do not show the negative regions of the laplacian for the
HF molecule since the latter species is situated outside the molecular graph projection. Probably such a configuration of the complex is observed because of the
repulsion between the fluorine atoms of CF 3 Cl and the fluorine atom of HF
molecule. Figure 15.5 presents also the reactive surface (∇
2
ρ(r) = 0 isosurface); this
picture may be read in the following way, the areas closed by those lines are
characterized by the negative values of the laplacian of electron density thus they
correspond to the concentration of the electron charge.
It was explained in terms of the σ-hole concept that the fluorine usually does not
possess the regions of positive EP since the high electronegativity of F-centre as
well as the sp-hybridization cause that the σ-hole usually occurring in the outermost
part of C–F bond is neutralized [32, 33]. Additionally the Lewis acid strength for
halogen atoms increases in the following order, F < Cl < Br < I what is connected
with the increase of the polarization of the corresponding C–X bonds (% of the
Fig. 15.5 The molecular graph of the CF 3 Cl…HF complex, solid and broken lines correspond to
bond paths, big circles to attractors and small green circles to BCPs, the isolines of laplacian of
electron density are also presented (the laplacian isodensity lines in the plane containing CFCl
atoms of the CF 3 Cl molecule); the reactive surface (∇
2
ρ(r) = 0 isosurface) is presented in the right
part of the figure
15 What Can Be Learnt from a Location of Bond Paths …
407