

this phenomenon. One can mention concepts of the anisotropy of the van der Waals
radii of halogens [29] or of the anisotropy of the electron charge distribution around
the halogen atoms [30]. According to the latter concept the electron density distribution of the halogen atom is characterized approximately by the ellipsoid shape,
the major axis of the ellipsoid is perpendicular to the C–X bond while the minor
axis belongs to the C–X bond line. This is why the X-centre interacts with
nucleophiles in the direction being the elongation of the C–X bond while electrophiles interact with halogens in the direction perpendicular to the C–X bond or
nearly so. The latter direction is rich in electron density while the elongation of the
C–X bond is characterized by the deficiency of the electron density. These explanations are in line with experimental findings; especially those based on the crystal
structures determinations [31].
It seems that more recent σ-hole concept [25–27], being in line with explanations
based on the anisotropy of the electron charge distribution, explains additionally the
source of such anisotropy as well as this concept explains sufficiently the phenomena
of numerous other interactions, not only of the halogen bond. The σ-hole concept of
Clark, Murray and Politzer is based on simple models of electron configurations and
hybridizations [32, 33]. For example, in a case of the CF 3 X molecules (X = Cl, Br
and I) the approximate s
2 p x
2 p y
2 p z
1 configuration is observed for X-atoms, where the
Z-axis is along the C–X bond. The unshared electron pairs are responsible for the
existence of the negative electrostatic potential (EP) around the X-atom in the
direction approximately perpendicular to the C–X bond while the single p z
1 electron
is involved in the C–X σ-bond what results in the loss of the electron density on the
outermost portion of the halogen surface, in the elongation of the C–X bond. This is
why this region (σ-hole) is characterized by the positive EP.
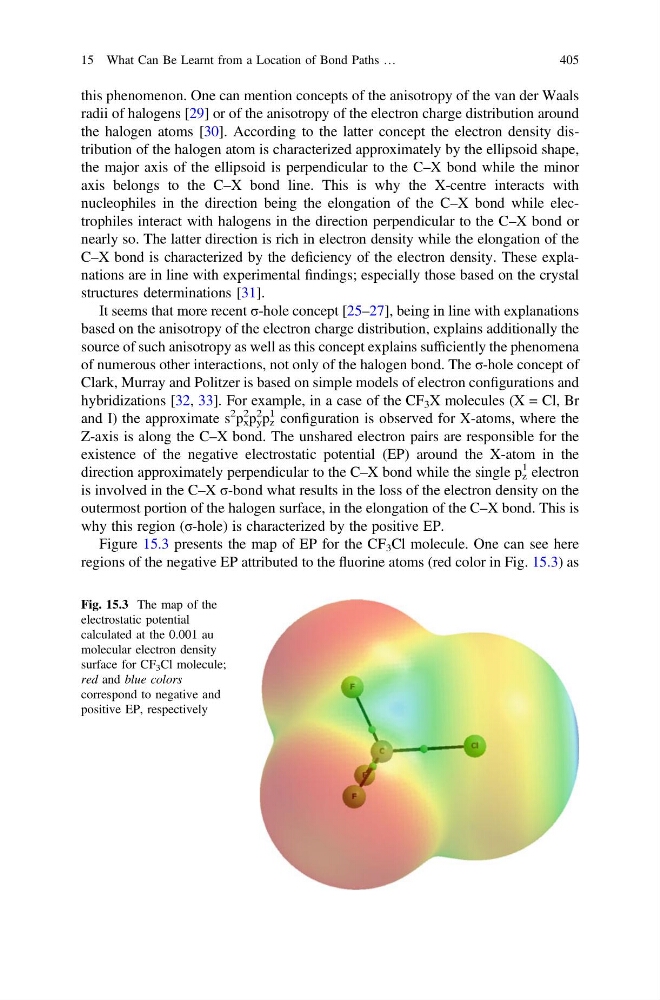
Figure 15.3 presents the map of EP for the CF 3 Cl molecule. One can see here
regions of the negative EP attributed to the fluorine atoms (red color in Fig. 15.3) as
Fig. 15.3 The map of the
electrostatic potential
calculated at the 0.001 au
molecular electron density
surface for CF 3 Cl molecule;
red and blue colors
correspond to negative and
positive EP, respectively
15 What Can Be Learnt from a Location of Bond Paths …
405
radii of halogens [29] or of the anisotropy of the electron charge distribution around
the halogen atoms [30]. According to the latter concept the electron density distribution of the halogen atom is characterized approximately by the ellipsoid shape,
the major axis of the ellipsoid is perpendicular to the C–X bond while the minor
axis belongs to the C–X bond line. This is why the X-centre interacts with
nucleophiles in the direction being the elongation of the C–X bond while electrophiles interact with halogens in the direction perpendicular to the C–X bond or
nearly so. The latter direction is rich in electron density while the elongation of the
C–X bond is characterized by the deficiency of the electron density. These explanations are in line with experimental findings; especially those based on the crystal
structures determinations [31].
It seems that more recent σ-hole concept [25–27], being in line with explanations
based on the anisotropy of the electron charge distribution, explains additionally the
source of such anisotropy as well as this concept explains sufficiently the phenomena
of numerous other interactions, not only of the halogen bond. The σ-hole concept of
Clark, Murray and Politzer is based on simple models of electron configurations and
hybridizations [32, 33]. For example, in a case of the CF 3 X molecules (X = Cl, Br
and I) the approximate s
2 p x
2 p y
2 p z
1 configuration is observed for X-atoms, where the
Z-axis is along the C–X bond. The unshared electron pairs are responsible for the
existence of the negative electrostatic potential (EP) around the X-atom in the
direction approximately perpendicular to the C–X bond while the single p z
1 electron
is involved in the C–X σ-bond what results in the loss of the electron density on the
outermost portion of the halogen surface, in the elongation of the C–X bond. This is
why this region (σ-hole) is characterized by the positive EP.
Figure 15.3 presents the map of EP for the CF 3 Cl molecule. One can see here
regions of the negative EP attributed to the fluorine atoms (red color in Fig. 15.3) as
Fig. 15.3 The map of the
electrostatic potential
calculated at the 0.001 au
molecular electron density
surface for CF 3 Cl molecule;
red and blue colors
correspond to negative and
positive EP, respectively
15 What Can Be Learnt from a Location of Bond Paths …
405