

respect to any other neighboring lines. Bader has pointed out that “one may define a
bond path operator as a Dirac observable, making the bond path the measurable
expectation value of a quantum mechanical operator” [10]. The bond path denotes
two atoms are bonded and it is not equivalent to the chemical bond [10]. The former
term can describe the complete range of bonded interactions and is attributed to the
electron charge accumulation between the pair of atoms, on the other hand the latter
term—bond is limited and dominated by the pair-electron concept of Lewis. This is
why the term “bond path” at least should be considered as an alternative way to
describe the arrangement of atoms in the species analyzed. This is discussed in the
next section.
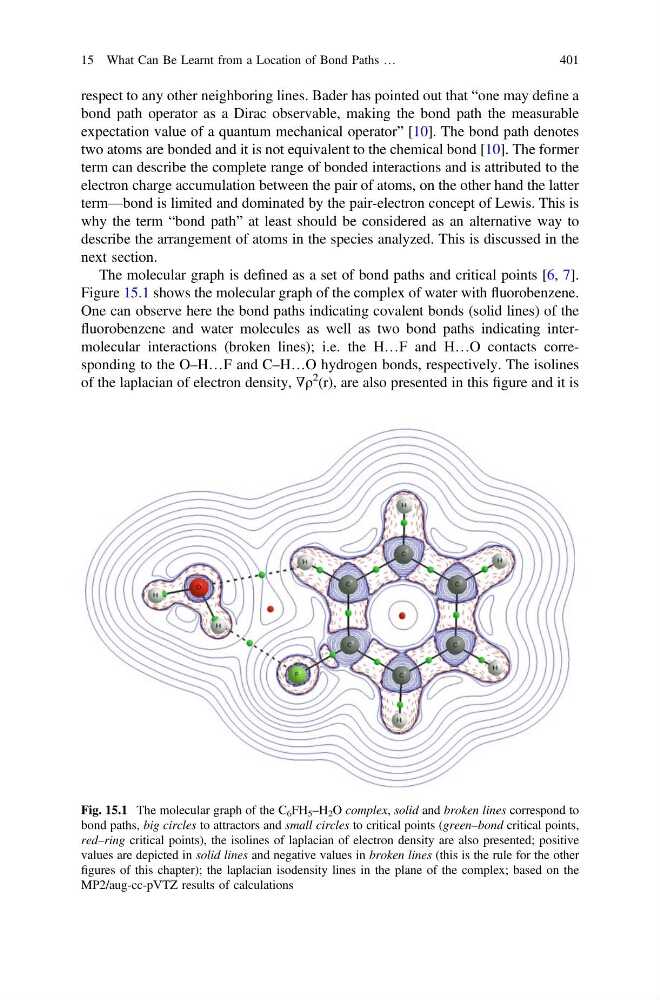
The molecular graph is defined as a set of bond paths and critical points [6, 7].
Figure 15.1 shows the molecular graph of the complex of water with fluorobenzene.
One can observe here the bond paths indicating covalent bonds (solid lines) of the
fluorobenzene and water molecules as well as two bond paths indicating intermolecular interactions (broken lines); i.e. the H…F and H…O contacts corresponding to the O–H…F and C–H…O hydrogen bonds, respectively. The isolines
of the laplacian of electron density, ∇ρ
2 (r), are also presented in this figure and it is
Fig. 15.1 The molecular graph of the C 6 FH 5 –H 2 O complex, solid and broken lines correspond to
bond paths, big circles to attractors and small circles to critical points (green–bond critical points,
red–ring critical points), the isolines of laplacian of electron density are also presented; positive
values are depicted in solid lines and negative values in broken lines (this is the rule for the other
figures of this chapter); the laplacian isodensity lines in the plane of the complex; based on the
MP2/aug-cc-pVTZ results of calculations
15 What Can Be Learnt from a Location of Bond Paths …
401
bond path operator as a Dirac observable, making the bond path the measurable
expectation value of a quantum mechanical operator” [10]. The bond path denotes
two atoms are bonded and it is not equivalent to the chemical bond [10]. The former
term can describe the complete range of bonded interactions and is attributed to the
electron charge accumulation between the pair of atoms, on the other hand the latter
term—bond is limited and dominated by the pair-electron concept of Lewis. This is
why the term “bond path” at least should be considered as an alternative way to
describe the arrangement of atoms in the species analyzed. This is discussed in the
next section.
The molecular graph is defined as a set of bond paths and critical points [6, 7].
Figure 15.1 shows the molecular graph of the complex of water with fluorobenzene.
One can observe here the bond paths indicating covalent bonds (solid lines) of the
fluorobenzene and water molecules as well as two bond paths indicating intermolecular interactions (broken lines); i.e. the H…F and H…O contacts corresponding to the O–H…F and C–H…O hydrogen bonds, respectively. The isolines
of the laplacian of electron density, ∇ρ
2 (r), are also presented in this figure and it is
Fig. 15.1 The molecular graph of the C 6 FH 5 –H 2 O complex, solid and broken lines correspond to
bond paths, big circles to attractors and small circles to critical points (green–bond critical points,
red–ring critical points), the isolines of laplacian of electron density are also presented; positive
values are depicted in solid lines and negative values in broken lines (this is the rule for the other
figures of this chapter); the laplacian isodensity lines in the plane of the complex; based on the
MP2/aug-cc-pVTZ results of calculations
15 What Can Be Learnt from a Location of Bond Paths …
401