

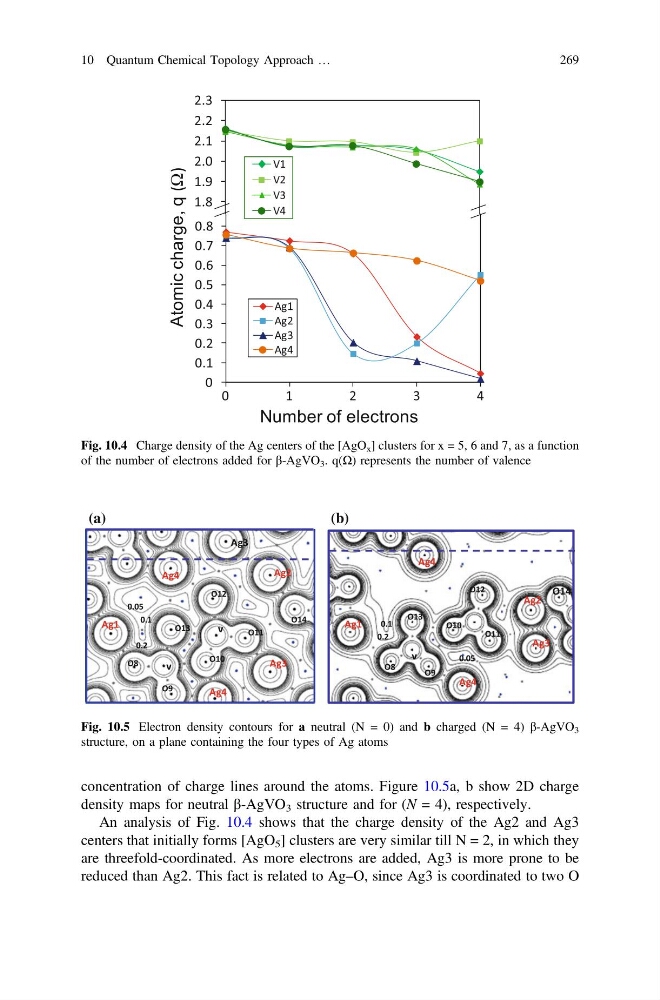
concentration of charge lines around the atoms. Figure 10.5a, b show 2D charge
density maps for neutral β-AgVO 3 structure and for (N = 4), respectively.
An analysis of Fig. 10.4 shows that the charge density of the Ag2 and Ag3
centers that initially forms [AgO 5 ] clusters are very similar till N = 2, in which they
are threefold-coordinated. As more electrons are added, Ag3 is more prone to be
reduced than Ag2. This fact is related to Ag–O, since Ag3 is coordinated to two O
Fig. 10.4 Charge density of the Ag centers of the [AgO x ] clusters for x = 5, 6 and 7, as a function
of the number of electrons added for β-AgVO 3 . q(Ω) represents the number of valence
(a)
(b)
Fig. 10.5 Electron density contours for a neutral (N = 0) and b charged (N = 4) β-AgVO 3
structure, on a plane containing the four types of Ag atoms
10 Quantum Chemical Topology Approach …
269
density maps for neutral β-AgVO 3 structure and for (N = 4), respectively.
An analysis of Fig. 10.4 shows that the charge density of the Ag2 and Ag3
centers that initially forms [AgO 5 ] clusters are very similar till N = 2, in which they
are threefold-coordinated. As more electrons are added, Ag3 is more prone to be
reduced than Ag2. This fact is related to Ag–O, since Ag3 is coordinated to two O
Fig. 10.4 Charge density of the Ag centers of the [AgO x ] clusters for x = 5, 6 and 7, as a function
of the number of electrons added for β-AgVO 3 . q(Ω) represents the number of valence
(a)
(b)
Fig. 10.5 Electron density contours for a neutral (N = 0) and b charged (N = 4) β-AgVO 3
structure, on a plane containing the four types of Ag atoms
10 Quantum Chemical Topology Approach …
269