

distances are reduced from 3.66 to 2.65 Å, while Ag2–Ag3 distances are practically
maintained its initial value.
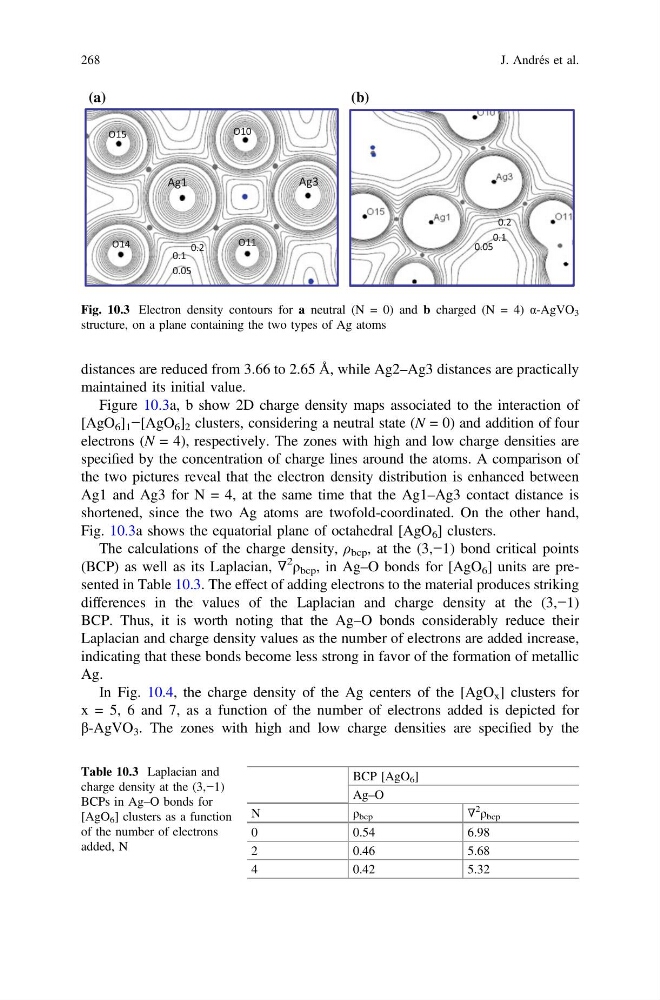
Figure 10.3a, b show 2D charge density maps associated to the interaction of
[AgO 6 ] 1 −[AgO 6 ] 2 clusters, considering a neutral state (N = 0) and addition of four
electrons (N = 4), respectively. The zones with high and low charge densities are
specified by the concentration of charge lines around the atoms. A comparison of
the two pictures reveal that the electron density distribution is enhanced between
Ag1 and Ag3 for N = 4, at the same time that the Ag1–Ag3 contact distance is
shortened, since the two Ag atoms are twofold-coordinated. On the other hand,
Fig. 10.3a shows the equatorial plane of octahedral [AgO 6 ] clusters.
The calculations of the charge density, ρ bcp , at the (3,−1) bond critical points
(BCP) as well as its Laplacian, ∇
2
ρ bcp , in Ag–O bonds for [AgO 6 ] units are presented in Table 10.3. The effect of adding electrons to the material produces striking
differences in the values of the Laplacian and charge density at the (3,−1)
BCP. Thus, it is worth noting that the Ag–O bonds considerably reduce their
Laplacian and charge density values as the number of electrons are added increase,
indicating that these bonds become less strong in favor of the formation of metallic
Ag.
In Fig. 10.4, the charge density of the Ag centers of the [AgO x ] clusters for
x = 5, 6 and 7, as a function of the number of electrons added is depicted for
β-AgVO 3 . The zones with high and low charge densities are specified by the
(a)
(b)
Fig. 10.3 Electron density contours for a neutral (N = 0) and b charged (N = 4) α-AgVO 3
structure, on a plane containing the two types of Ag atoms
Table 10.3 Laplacian and
charge density at the (3,−1)
BCPs in Ag–O bonds for
[AgO 6 ] clusters as a function
of the number of electrons
added, N
BCP [AgO 6 ]
Ag–O
N
ρ bcp
∇
2
ρ bcp
0
0.54
6.98
2
0.46
5.68
4
0.42
5.32
268
J. Andrés et al.
maintained its initial value.
Figure 10.3a, b show 2D charge density maps associated to the interaction of
[AgO 6 ] 1 −[AgO 6 ] 2 clusters, considering a neutral state (N = 0) and addition of four
electrons (N = 4), respectively. The zones with high and low charge densities are
specified by the concentration of charge lines around the atoms. A comparison of
the two pictures reveal that the electron density distribution is enhanced between
Ag1 and Ag3 for N = 4, at the same time that the Ag1–Ag3 contact distance is
shortened, since the two Ag atoms are twofold-coordinated. On the other hand,
Fig. 10.3a shows the equatorial plane of octahedral [AgO 6 ] clusters.
The calculations of the charge density, ρ bcp , at the (3,−1) bond critical points
(BCP) as well as its Laplacian, ∇
2
ρ bcp , in Ag–O bonds for [AgO 6 ] units are presented in Table 10.3. The effect of adding electrons to the material produces striking
differences in the values of the Laplacian and charge density at the (3,−1)
BCP. Thus, it is worth noting that the Ag–O bonds considerably reduce their
Laplacian and charge density values as the number of electrons are added increase,
indicating that these bonds become less strong in favor of the formation of metallic
Ag.
In Fig. 10.4, the charge density of the Ag centers of the [AgO x ] clusters for
x = 5, 6 and 7, as a function of the number of electrons added is depicted for
β-AgVO 3 . The zones with high and low charge densities are specified by the
(a)
(b)
Fig. 10.3 Electron density contours for a neutral (N = 0) and b charged (N = 4) α-AgVO 3
structure, on a plane containing the two types of Ag atoms
Table 10.3 Laplacian and
charge density at the (3,−1)
BCPs in Ag–O bonds for
[AgO 6 ] clusters as a function
of the number of electrons
added, N
BCP [AgO 6 ]
Ag–O
N
ρ bcp
∇
2
ρ bcp
0
0.54
6.98
2
0.46
5.68
4
0.42
5.32
268
J. Andrés et al.