

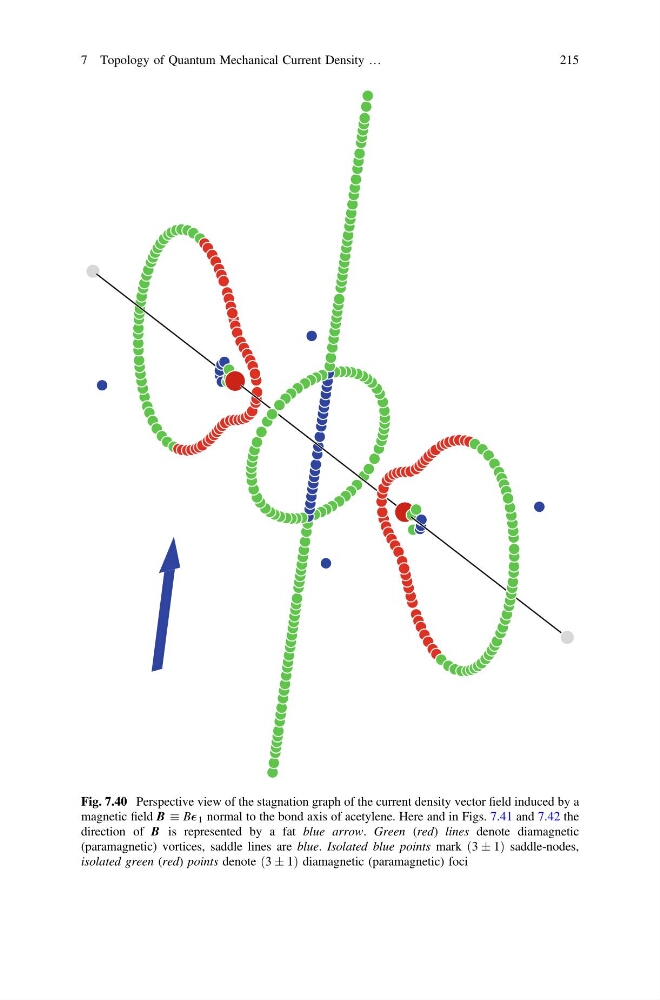
Fig. 7.40 Perspective view of the stagnation graph of the current density vector field induced by a
magnetic field B B 1 normal to the bond axis of acetylene. Here and in Figs. 7.41 and 7.42 the
direction of B is represented by a fat blue arrow. Green (red) lines denote diamagnetic
(paramagnetic) vortices, saddle lines are blue. Isolated blue points mark ð3 Æ 1Þ saddle-nodes,
isolated green (red) points denote ð3 Æ 1Þ diamagnetic (paramagnetic) foci
7 Topology of Quantum Mechanical Current Density …
215
magnetic field B B 1 normal to the bond axis of acetylene. Here and in Figs. 7.41 and 7.42 the
direction of B is represented by a fat blue arrow. Green (red) lines denote diamagnetic
(paramagnetic) vortices, saddle lines are blue. Isolated blue points mark ð3 Æ 1Þ saddle-nodes,
isolated green (red) points denote ð3 Æ 1Þ diamagnetic (paramagnetic) foci
7 Topology of Quantum Mechanical Current Density …
215