

delocalization effects by suitably choosing reference points other than
bcp. According with our previous study on simple aromatic hydrocarbons [15], we
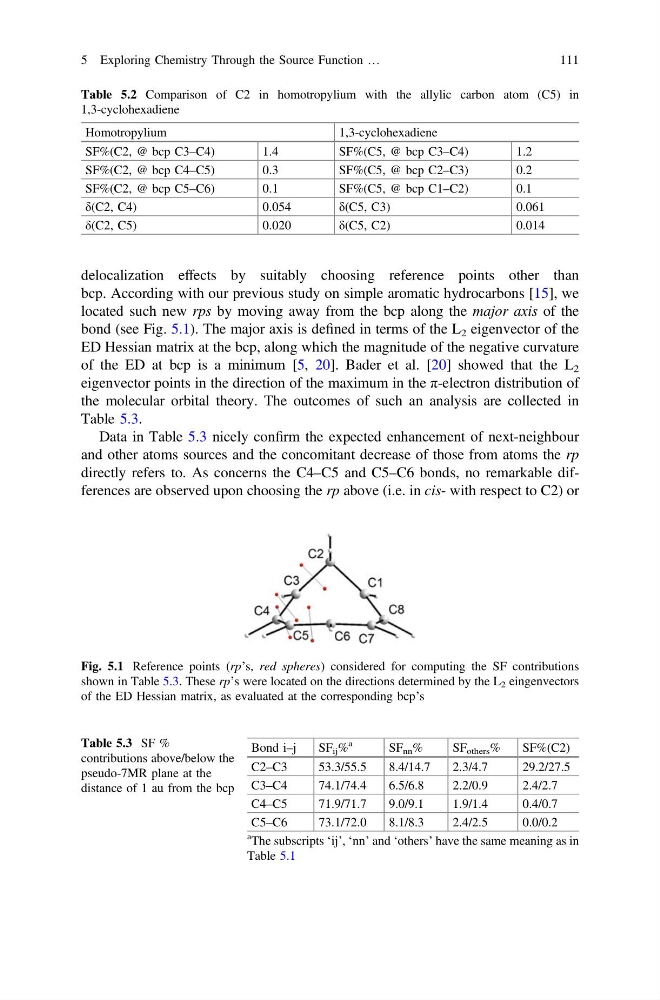
located such new rps by moving away from the bcp along the major axis of the
bond (see Fig. 5.1). The major axis is defined in terms of the L 2 eigenvector of the
ED Hessian matrix at the bcp, along which the magnitude of the negative curvature
of the ED at bcp is a minimum [5, 20]. Bader et al. [20] showed that the L 2
eigenvector points in the direction of the maximum in the π-electron distribution of
the molecular orbital theory. The outcomes of such an analysis are collected in
Table 5.3.
Data in Table 5.3 nicely confirm the expected enhancement of next-neighbour
and other atoms sources and the concomitant decrease of those from atoms the rp
directly refers to. As concerns the C4–C5 and C5–C6 bonds, no remarkable differences are observed upon choosing the rp above (i.e. in cis- with respect to C2) or
Table 5.2 Comparison of C2 in homotropylium with the allylic carbon atom (C5) in
1,3-cyclohexadiene
Homotropylium
1,3-cyclohexadiene
SF%(C2, @ bcp C3–C4)
1.4
SF%(C5, @ bcp C3–C4)
1.2
SF%(C2, @ bcp C4–C5)
0.3
SF%(C5, @ bcp C2–C3)
0.2
SF%(C2, @ bcp C5–C6)
0.1
SF%(C5, @ bcp C1–C2)
0.1
δ(C2, C4)
0.054
δ(C5, C3)
0.061
δ(C2, C5)
0.020
δ(C5, C2)
0.014
Fig. 5.1 Reference points (rp’s, red spheres) considered for computing the SF contributions
shown in Table 5.3. These rp’s were located on the directions determined by the L 2 eingenvectors
of the ED Hessian matrix, as evaluated at the corresponding bcp’s
Table 5.3 SF %
contributions above/below the
pseudo-7MR plane at the
distance of 1 au from the bcp
Bond i–j
SF ij %
a
SF nn %
SF others %
SF%(C2)
C2–C3
53.3/55.5
8.4/14.7
2.3/4.7
29.2/27.5
C3–C4
74.1/74.4
6.5/6.8
2.2/0.9
2.4/2.7
C4–C5
71.9/71.7
9.0/9.1
1.9/1.4
0.4/0.7
C5–C6
73.1/72.0
8.1/8.3
2.4/2.5
0.0/0.2
a The subscripts ‘ij’, ‘nn’ and ‘others’ have the same meaning as in
Table 5.1
5 Exploring Chemistry Through the Source Function …
111
bcp. According with our previous study on simple aromatic hydrocarbons [15], we
located such new rps by moving away from the bcp along the major axis of the
bond (see Fig. 5.1). The major axis is defined in terms of the L 2 eigenvector of the
ED Hessian matrix at the bcp, along which the magnitude of the negative curvature
of the ED at bcp is a minimum [5, 20]. Bader et al. [20] showed that the L 2
eigenvector points in the direction of the maximum in the π-electron distribution of
the molecular orbital theory. The outcomes of such an analysis are collected in
Table 5.3.
Data in Table 5.3 nicely confirm the expected enhancement of next-neighbour
and other atoms sources and the concomitant decrease of those from atoms the rp
directly refers to. As concerns the C4–C5 and C5–C6 bonds, no remarkable differences are observed upon choosing the rp above (i.e. in cis- with respect to C2) or
Table 5.2 Comparison of C2 in homotropylium with the allylic carbon atom (C5) in
1,3-cyclohexadiene
Homotropylium
1,3-cyclohexadiene
SF%(C2, @ bcp C3–C4)
1.4
SF%(C5, @ bcp C3–C4)
1.2
SF%(C2, @ bcp C4–C5)
0.3
SF%(C5, @ bcp C2–C3)
0.2
SF%(C2, @ bcp C5–C6)
0.1
SF%(C5, @ bcp C1–C2)
0.1
δ(C2, C4)
0.054
δ(C5, C3)
0.061
δ(C2, C5)
0.020
δ(C5, C2)
0.014
Fig. 5.1 Reference points (rp’s, red spheres) considered for computing the SF contributions
shown in Table 5.3. These rp’s were located on the directions determined by the L 2 eingenvectors
of the ED Hessian matrix, as evaluated at the corresponding bcp’s
Table 5.3 SF %
contributions above/below the
pseudo-7MR plane at the
distance of 1 au from the bcp
Bond i–j
SF ij %
a
SF nn %
SF others %
SF%(C2)
C2–C3
53.3/55.5
8.4/14.7
2.3/4.7
29.2/27.5
C3–C4
74.1/74.4
6.5/6.8
2.2/0.9
2.4/2.7
C4–C5
71.9/71.7
9.0/9.1
1.9/1.4
0.4/0.7
C5–C6
73.1/72.0
8.1/8.3
2.4/2.5
0.0/0.2
a The subscripts ‘ij’, ‘nn’ and ‘others’ have the same meaning as in
Table 5.1
5 Exploring Chemistry Through the Source Function …
111