

6 Hydrocarbon Activation by [Tp
0 Rh(P(OMe) 3 )]
As a third test of the effect of the ancillary or “spectator” ligand on the strength of
the metal–carbon bond, we set out to use trimethylphosphite as the ligand.
Trimethylphosphite is in between trimethylphosphine and neopentylisocyanide in
donor/acceptor strength [19], and therefore, we predicted that the slope for the
corresponding range of bond strengths should lie in between those found above. As
with the PMe 3 series of compounds, two approaches were examined for the
formation of the {Tp
0 Rh[P(OMe) 3 ]} fragment.
One approach uses Tp
0 Rh[P(OMe) 3 ]H 2 (7) as a photochemical precursor of the
fragment, and the second uses Tp
0 Rh[P(OMe) 3 ]MeH (8) as the precursor [20]. As in
the case with L ¼ PMe 3 , irradiation of 7 in hydrocarbon solvents gave the desired
products but also showed evidence of several side products. The use of the thermal
precursor showed improved product selectivity, and therefore, this was chosen as
the route for preparing hydrocarbon activation products. As in the case of PMe 3 , the
activation of THF solvent during the preparation of 8 led to the formation of some
Tp
0 Rh[P(OMe) 3 ](tetrahydrofuranyl)H in the solution containing 8, but both served
-35
-25
-15
-5
5
15
25
80
90
100
110
120
130
Carbon-Hydrogen Bond Strengths (kcal/mol)
Relative M-C Bond Strengths
(kcal/mol)
c-pentyl
n-pentyl
slope = 1.71(8)
CHF 2
CH 2 F
CH 2 O
t Bu
ArCH 2
CH 2 C(O)Me
+ CH 2 OMe
methyl
t-butylvinyl
phenyl
CH 2 CF 3
slope = 1.54(4)
R-CaC-, R = CF 3 , hexyl,
SiMe 3 , t-Bu, Ph,
C 6 H 4 CF 3 , C 6 H 4 OMe
sp
sp
2
sp
3
Tp'Rh(PMe 3 )RH
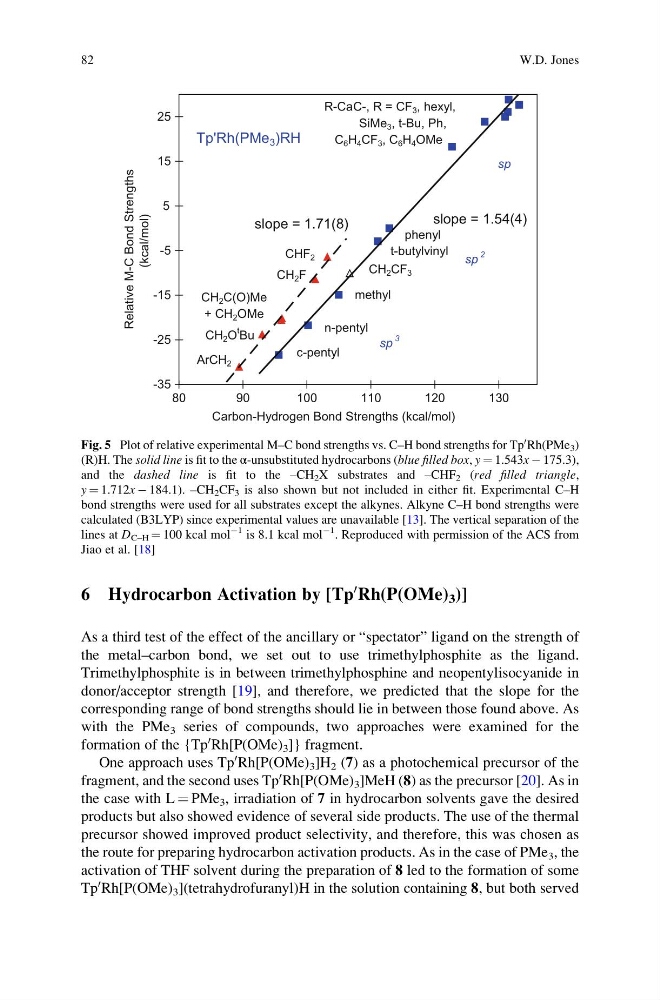
Fig. 5 Plot of relative experimental M–C bond strengths vs. C–H bond strengths for Tp
0 Rh(PMe 3 )
(R)H. The solid line is fit to the α-unsubstituted hydrocarbons (blue filled box, y ¼ 1.543x À 175.3),
and the dashed line is fit to the –CH 2 X substrates and –CHF 2 (red filled triangle,
y ¼ 1.712x À 184.1). –CH 2 CF 3 is also shown but not included in either fit. Experimental C–H
bond strengths were used for all substrates except the alkynes. Alkyne C–H bond strengths were
calculated (B3LYP) since experimental values are unavailable [13]. The vertical separation of the
lines at D C–H ¼ 100 kcal mol
À1 is 8.1 kcal mol
À1 . Reproduced with permission of the ACS from
Jiao et al. [18]
82
W.D. Jones
0 Rh(P(OMe) 3 )]
As a third test of the effect of the ancillary or “spectator” ligand on the strength of
the metal–carbon bond, we set out to use trimethylphosphite as the ligand.
Trimethylphosphite is in between trimethylphosphine and neopentylisocyanide in
donor/acceptor strength [19], and therefore, we predicted that the slope for the
corresponding range of bond strengths should lie in between those found above. As
with the PMe 3 series of compounds, two approaches were examined for the
formation of the {Tp
0 Rh[P(OMe) 3 ]} fragment.
One approach uses Tp
0 Rh[P(OMe) 3 ]H 2 (7) as a photochemical precursor of the
fragment, and the second uses Tp
0 Rh[P(OMe) 3 ]MeH (8) as the precursor [20]. As in
the case with L ¼ PMe 3 , irradiation of 7 in hydrocarbon solvents gave the desired
products but also showed evidence of several side products. The use of the thermal
precursor showed improved product selectivity, and therefore, this was chosen as
the route for preparing hydrocarbon activation products. As in the case of PMe 3 , the
activation of THF solvent during the preparation of 8 led to the formation of some
Tp
0 Rh[P(OMe) 3 ](tetrahydrofuranyl)H in the solution containing 8, but both served
-35
-25
-15
-5
5
15
25
80
90
100
110
120
130
Carbon-Hydrogen Bond Strengths (kcal/mol)
Relative M-C Bond Strengths
(kcal/mol)
c-pentyl
n-pentyl
slope = 1.71(8)
CHF 2
CH 2 F
CH 2 O
t Bu
ArCH 2
CH 2 C(O)Me
+ CH 2 OMe
methyl
t-butylvinyl
phenyl
CH 2 CF 3
slope = 1.54(4)
R-CaC-, R = CF 3 , hexyl,
SiMe 3 , t-Bu, Ph,
C 6 H 4 CF 3 , C 6 H 4 OMe
sp
sp
2
sp
3
Tp'Rh(PMe 3 )RH
Fig. 5 Plot of relative experimental M–C bond strengths vs. C–H bond strengths for Tp
0 Rh(PMe 3 )
(R)H. The solid line is fit to the α-unsubstituted hydrocarbons (blue filled box, y ¼ 1.543x À 175.3),
and the dashed line is fit to the –CH 2 X substrates and –CHF 2 (red filled triangle,
y ¼ 1.712x À 184.1). –CH 2 CF 3 is also shown but not included in either fit. Experimental C–H
bond strengths were used for all substrates except the alkynes. Alkyne C–H bond strengths were
calculated (B3LYP) since experimental values are unavailable [13]. The vertical separation of the
lines at D C–H ¼ 100 kcal mol
À1 is 8.1 kcal mol
À1 . Reproduced with permission of the ACS from
Jiao et al. [18]
82
W.D. Jones