

of strengths for the substituted methyl derivatives is also “stretched out” for
L ¼ PMe 3 vs. L ¼ CNneopentyl.
These trends can also be calculated using DFT and the full [Tp
0 Rh(PMe 3 )]
fragment as the model. The results are shown in Fig. 6. Two nearly parallel lines
are seen, with the substituted methyl derivatives lying about 12 kcal/mol higher
than the hydrocarbons. As before, the slopes by DFT show about 12–13% variance
with experiment. The calculated slope for the hydrocarbons is too large, whereas
the calculated slope for the substituted methyl derivatives is too small.
The larger slopes for L ¼ PMe 3 vs. L ¼ CNneopentyl indicate that the range of
Rh–C bond strengths for the σ-donor complex is larger than for the π-acceptor
complex. This has the experimental ramification that the weakest complexes with
L ¼ PMe 3 appear less stable than with L ¼ CNneopentyl and that the strongest
complexes with L ¼ PMe 3 appear much more stable than with L ¼ neopentyl. For
example, Tp
0 Rh(CNneopentyl)(n-pentyl)H loses pentane with a half-life of about
1 h at 30
C, whereas Tp
0 Rh(PMe 3 )(n-pentyl)H loses pentane with a half-life of
about 30 min at only 9
C. Likewise, loss of phenylacetylene from Tp
0 Rh
(CNneopentyl)(CCPh)H occurs with a half-life of about 74 h at 100
C, compared
with 60 h at 140
C for Tp
0 Rh(PMe 3 )(CCPh)H, a much more difficult elimination.
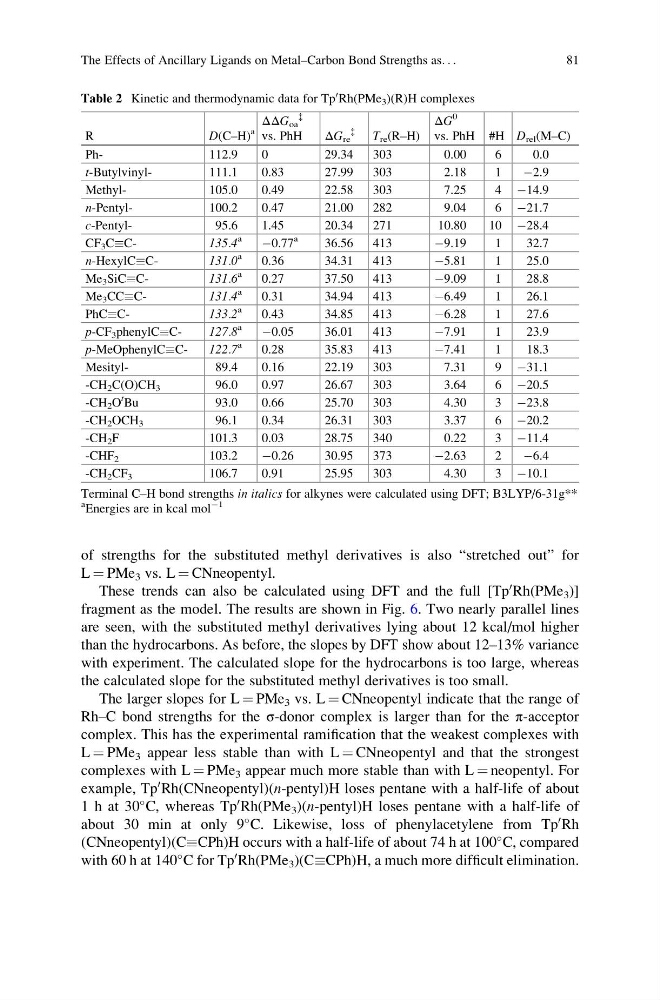
Table 2 Kinetic and thermodynamic data for Tp
0 Rh(PMe 3 )(R)H complexes
R
D(C–H)
a
ΔΔG oa
{
vs. PhH
ΔG re
{
T re (R–H)
ΔG
0
vs. PhH #H D rel (M–C)
Ph112.9
0
29.34
303
0.00
6
0.0
t-Butylvinyl111.1
0.83
27.99
303
2.18
1
À2.9
Methyl105.0
0.49
22.58
303
7.25
4 À14.9
n-Pentyl100.2
0.47
21.00
282
9.04
6 À21.7
c-Pentyl95.6
1.45
20.34
271
10.80
10 À28.4
CF 3 CC135.4
a
À0.77
a
36.56
413
À9.19
1
32.7
n-HexylCC131.0
a
0.36
34.31
413
À5.81
1
25.0
Me 3 SiCC131.6
a
0.27
37.50
413
À9.09
1
28.8
Me 3 CCC131.4
a
0.31
34.94
413
À6.49
1
26.1
PhCC133.2
a
0.43
34.85
413
À6.28
1
27.6
p-CF 3 phenylCC127.8
a
À0.05
36.01
413
À7.91
1
23.9
p-MeOphenylCC122.7
a
0.28
35.83
413
À7.41
1
18.3
Mesityl89.4
0.16
22.19
303
7.31
9 À31.1
-CH 2 C(O)CH 3
96.0
0.97
26.67
303
3.64
6 À20.5
-CH 2 O
t Bu
93.0
0.66
25.70
303
4.30
3 À23.8
-CH 2 OCH 3
96.1
0.34
26.31
303
3.37
6 À20.2
-CH 2 F
101.3
0.03
28.75
340
0.22
3 À11.4
-CHF 2
103.2
À0.26
30.95
373
À2.63
2
À6.4
-CH 2 CF 3
106.7
0.91
25.95
303
4.30
3 À10.1
Terminal C–H bond strengths in italics for alkynes were calculated using DFT; B3LYP/6-31g**
a
Energies are in kcal mol
À1
The Effects of Ancillary Ligands on Metal–Carbon Bond Strengths as. . .
81
L ¼ PMe 3 vs. L ¼ CNneopentyl.
These trends can also be calculated using DFT and the full [Tp
0 Rh(PMe 3 )]
fragment as the model. The results are shown in Fig. 6. Two nearly parallel lines
are seen, with the substituted methyl derivatives lying about 12 kcal/mol higher
than the hydrocarbons. As before, the slopes by DFT show about 12–13% variance
with experiment. The calculated slope for the hydrocarbons is too large, whereas
the calculated slope for the substituted methyl derivatives is too small.
The larger slopes for L ¼ PMe 3 vs. L ¼ CNneopentyl indicate that the range of
Rh–C bond strengths for the σ-donor complex is larger than for the π-acceptor
complex. This has the experimental ramification that the weakest complexes with
L ¼ PMe 3 appear less stable than with L ¼ CNneopentyl and that the strongest
complexes with L ¼ PMe 3 appear much more stable than with L ¼ neopentyl. For
example, Tp
0 Rh(CNneopentyl)(n-pentyl)H loses pentane with a half-life of about
1 h at 30
C, whereas Tp
0 Rh(PMe 3 )(n-pentyl)H loses pentane with a half-life of
about 30 min at only 9
C. Likewise, loss of phenylacetylene from Tp
0 Rh
(CNneopentyl)(CCPh)H occurs with a half-life of about 74 h at 100
C, compared
with 60 h at 140
C for Tp
0 Rh(PMe 3 )(CCPh)H, a much more difficult elimination.
Table 2 Kinetic and thermodynamic data for Tp
0 Rh(PMe 3 )(R)H complexes
R
D(C–H)
a
ΔΔG oa
{
vs. PhH
ΔG re
{
T re (R–H)
ΔG
0
vs. PhH #H D rel (M–C)
Ph112.9
0
29.34
303
0.00
6
0.0
t-Butylvinyl111.1
0.83
27.99
303
2.18
1
À2.9
Methyl105.0
0.49
22.58
303
7.25
4 À14.9
n-Pentyl100.2
0.47
21.00
282
9.04
6 À21.7
c-Pentyl95.6
1.45
20.34
271
10.80
10 À28.4
CF 3 CC135.4
a
À0.77
a
36.56
413
À9.19
1
32.7
n-HexylCC131.0
a
0.36
34.31
413
À5.81
1
25.0
Me 3 SiCC131.6
a
0.27
37.50
413
À9.09
1
28.8
Me 3 CCC131.4
a
0.31
34.94
413
À6.49
1
26.1
PhCC133.2
a
0.43
34.85
413
À6.28
1
27.6
p-CF 3 phenylCC127.8
a
À0.05
36.01
413
À7.91
1
23.9
p-MeOphenylCC122.7
a
0.28
35.83
413
À7.41
1
18.3
Mesityl89.4
0.16
22.19
303
7.31
9 À31.1
-CH 2 C(O)CH 3
96.0
0.97
26.67
303
3.64
6 À20.5
-CH 2 O
t Bu
93.0
0.66
25.70
303
4.30
3 À23.8
-CH 2 OCH 3
96.1
0.34
26.31
303
3.37
6 À20.2
-CH 2 F
101.3
0.03
28.75
340
0.22
3 À11.4
-CHF 2
103.2
À0.26
30.95
373
À2.63
2
À6.4
-CH 2 CF 3
106.7
0.91
25.95
303
4.30
3 À10.1
Terminal C–H bond strengths in italics for alkynes were calculated using DFT; B3LYP/6-31g**
a
Energies are in kcal mol
À1
The Effects of Ancillary Ligands on Metal–Carbon Bond Strengths as. . .
81