

444
I. I. Baskin and N. I. Zhokhova
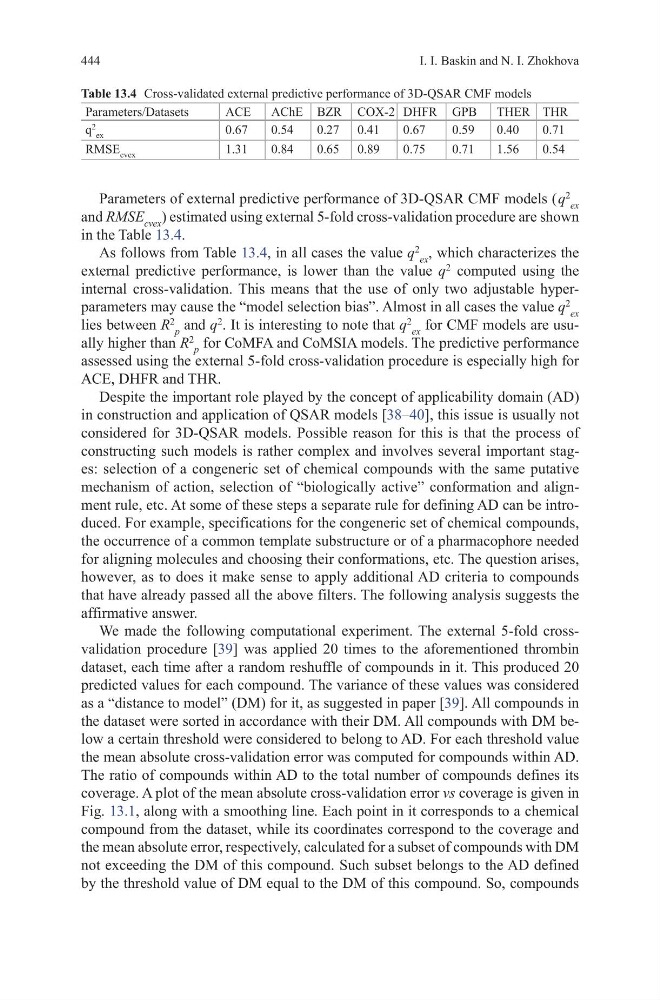
Parameters of external predictive performance of 3D-QSAR CMF models ( q
2 ex
and RMSE cvex ) estimated using external 5-fold cross-validation procedure are shown
in the Table 13.4.
As follows from Table 13.4, in all cases the value q
2 ex
, which characterizes the
external predictive performance, is lower than the value q
2
computed using the
internal cross-validation. This means that the use of only two adjustable hyperparameters may cause the “model selection bias”. Almost in all cases the value q
2 ex
lies between R
2 p
and q
2
. It is interesting to note that q
2 ex
for CMF models are usually higher than R
2 p
for CoMFA and CoMSIA models. The predictive performance
assessed using the external 5-fold cross-validation procedure is especially high for
ACE, DHFR and THR.
Despite the important role played by the concept of applicability domain (AD)
in construction and application of QSAR models [38–40], this issue is usually not
considered for 3D-QSAR models. Possible reason for this is that the process of
constructing such models is rather complex and involves several important stages: selection of a congeneric set of chemical compounds with the same putative
mechanism of action, selection of “biologically active” conformation and alignment rule, etc. At some of these steps a separate rule for defining AD can be introduced. For example, specifications for the congeneric set of chemical compounds,
the occurrence of a common template substructure or of a pharmacophore needed
for aligning molecules and choosing their conformations, etc. The question arises,
however, as to does it make sense to apply additional AD criteria to compounds
that have already passed all the above filters. The following analysis suggests the
affirmative answer.
We made the following computational experiment. The external 5-fold crossvalidation procedure [39] was applied 20 times to the aforementioned thrombin
dataset, each time after a random reshuffle of compounds in it. This produced 20
predicted values for each compound. The variance of these values was considered
as a “distance to model” (DM) for it, as suggested in paper [39]. All compounds in
the dataset were sorted in accordance with their DM. All compounds with DM below a certain threshold were considered to belong to AD. For each threshold value
the mean absolute cross-validation error was computed for compounds within AD.
The ratio of compounds within AD to the total number of compounds defines its
coverage. A plot of the mean absolute cross-validation error vs coverage is given in
Fig. 13.1, along with a smoothing line. Each point in it corresponds to a chemical
compound from the dataset, while its coordinates correspond to the coverage and
the mean absolute error, respectively, calculated for a subset of compounds with DM
not exceeding the DM of this compound. Such subset belongs to the AD defined
by the threshold value of DM equal to the DM of this compound. So, compounds
Table 13.4 Cross-validated external predictive performance of 3D-QSAR CMF models
Parameters/Datasets
ACE
AChE BZR COX-2 DHFR GPB
THER THR
q
2
ex
0.67
0.54
0.27 0.41
0.67
0.59
0.40
0.71
RMSE cvex
1.31
0.84
0.65 0.89
0.75
0.71
1.56
0.54
I. I. Baskin and N. I. Zhokhova
Parameters of external predictive performance of 3D-QSAR CMF models ( q
2 ex
and RMSE cvex ) estimated using external 5-fold cross-validation procedure are shown
in the Table 13.4.
As follows from Table 13.4, in all cases the value q
2 ex
, which characterizes the
external predictive performance, is lower than the value q
2
computed using the
internal cross-validation. This means that the use of only two adjustable hyperparameters may cause the “model selection bias”. Almost in all cases the value q
2 ex
lies between R
2 p
and q
2
. It is interesting to note that q
2 ex
for CMF models are usually higher than R
2 p
for CoMFA and CoMSIA models. The predictive performance
assessed using the external 5-fold cross-validation procedure is especially high for
ACE, DHFR and THR.
Despite the important role played by the concept of applicability domain (AD)
in construction and application of QSAR models [38–40], this issue is usually not
considered for 3D-QSAR models. Possible reason for this is that the process of
constructing such models is rather complex and involves several important stages: selection of a congeneric set of chemical compounds with the same putative
mechanism of action, selection of “biologically active” conformation and alignment rule, etc. At some of these steps a separate rule for defining AD can be introduced. For example, specifications for the congeneric set of chemical compounds,
the occurrence of a common template substructure or of a pharmacophore needed
for aligning molecules and choosing their conformations, etc. The question arises,
however, as to does it make sense to apply additional AD criteria to compounds
that have already passed all the above filters. The following analysis suggests the
affirmative answer.
We made the following computational experiment. The external 5-fold crossvalidation procedure [39] was applied 20 times to the aforementioned thrombin
dataset, each time after a random reshuffle of compounds in it. This produced 20
predicted values for each compound. The variance of these values was considered
as a “distance to model” (DM) for it, as suggested in paper [39]. All compounds in
the dataset were sorted in accordance with their DM. All compounds with DM below a certain threshold were considered to belong to AD. For each threshold value
the mean absolute cross-validation error was computed for compounds within AD.
The ratio of compounds within AD to the total number of compounds defines its
coverage. A plot of the mean absolute cross-validation error vs coverage is given in
Fig. 13.1, along with a smoothing line. Each point in it corresponds to a chemical
compound from the dataset, while its coordinates correspond to the coverage and
the mean absolute error, respectively, calculated for a subset of compounds with DM
not exceeding the DM of this compound. Such subset belongs to the AD defined
by the threshold value of DM equal to the DM of this compound. So, compounds
Table 13.4 Cross-validated external predictive performance of 3D-QSAR CMF models
Parameters/Datasets
ACE
AChE BZR COX-2 DHFR GPB
THER THR
q
2
ex
0.67
0.54
0.27 0.41
0.67
0.59
0.40
0.71
RMSE cvex
1.31
0.84
0.65 0.89
0.75
0.71
1.56
0.54