

442
I. I. Baskin and N. I. Zhokhova
partial charges [36] had been calculated for all atoms with MOPAC 6.0, except that
for the THER set all partial charges on atoms had been computed using the Gasteiger-Marsili method [37] as also implemented in Sybyl. Several characteristics of
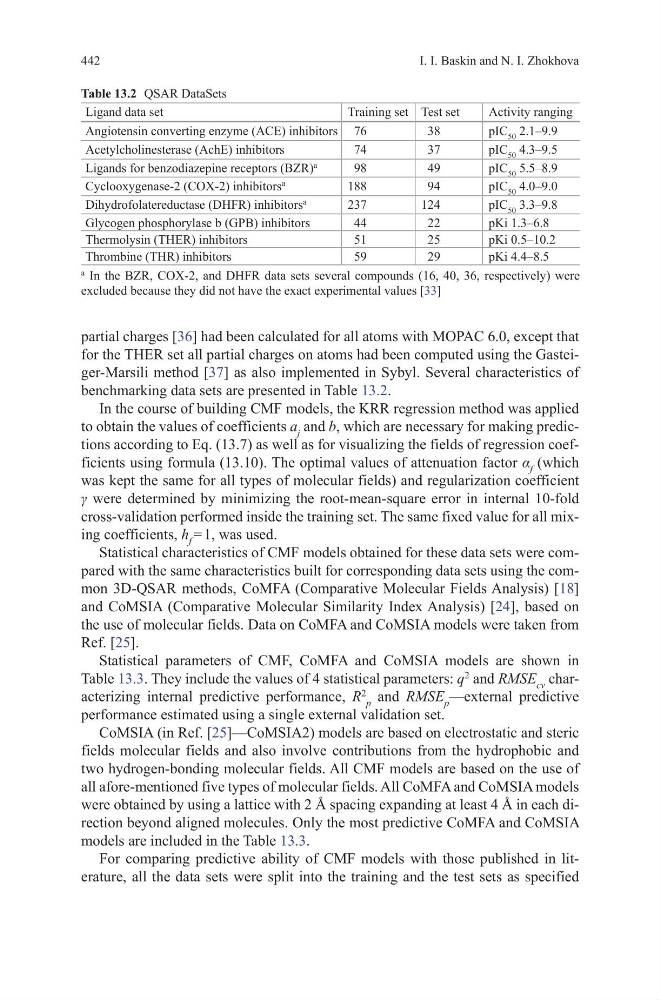
benchmarking data sets are presented in Table 13.2.
In the course of building CMF models, the KRR regression method was applied
to obtain the values of coefficients a j and b, which are necessary for making predictions according to Eq. (13.7) as well as for visualizing the fields of regression coefficients using formula (13.10). The optimal values of attenuation factor α f (which
was kept the same for all types of molecular fields) and regularization coefficient
γ were determined by minimizing the root-mean-square error in internal 10-fold
cross-validation performed inside the training set. The same fixed value for all mixing coefficients, h f = 1, was used.
Statistical characteristics of CMF models obtained for these data sets were compared with the same characteristics built for corresponding data sets using the common 3D-QSAR methods, CoMFA (Comparative Molecular Fields Analysis) [18]
and CoMSIA (Comparative Molecular Similarity Index Analysis) [24], based on
the use of molecular fields. Data on CoMFA and CoMSIA models were taken from
Ref. [25].
Statistical parameters of CMF, CoMFA and CoMSIA models are shown in
Table 13.3. They include the values of 4 statistical parameters: q
2
and RMSE cv characterizing internal predictive performance, R
2 p
and RMSE p —external predictive
performance estimated using a single external validation set.
CoMSIA (in Ref. [25]—CoMSIA2) models are based on electrostatic and steric
fields molecular fields and also involve contributions from the hydrophobic and
two hydrogen-bonding molecular fields. All CMF models are based on the use of
all afore-mentioned five types of molecular fields. All CoMFA and CoMSIA models
were obtained by using a lattice with 2 Å spacing expanding at least 4 Å in each direction beyond aligned molecules. Only the most predictive CoMFA and CoMSIA
models are included in the Table 13.3.
For comparing predictive ability of CMF models with those published in literature, all the data sets were split into the training and the test sets as specified
Table 13.2 QSAR DataSets
Ligand data set
Training set Test set
Activity ranging
Angiotensin converting enzyme (ACE) inhibitors 76
38
pIC 50 2.1–9.9
Acetylcholinesterase (AchE) inhibitors
74
37
pIC 50 4.3–9.5
Ligands for benzodiazepine receptors (BZR)
a
98
49
pIC 50 5.5–8.9
Cyclooxygenase-2 (COX-2) inhibitors
a
188
94
pIC 50 4.0–9.0
Dihydrofolatereductase (DHFR) inhibitors
a
237
124
pIC 50 3.3–9.8
Glycogen phosphorylase b (GPB) inhibitors
44
22
pKi 1.3–6.8
Thermolysin (THER) inhibitors
51
25
pKi 0.5–10.2
Thrombine (THR) inhibitors
59
29
pKi 4.4–8.5
a
In the BZR, COX-2, and DHFR data sets several compounds (16, 40, 36, respectively) were
excluded because they did not have the exact experimental values [33]
I. I. Baskin and N. I. Zhokhova
partial charges [36] had been calculated for all atoms with MOPAC 6.0, except that
for the THER set all partial charges on atoms had been computed using the Gasteiger-Marsili method [37] as also implemented in Sybyl. Several characteristics of
benchmarking data sets are presented in Table 13.2.
In the course of building CMF models, the KRR regression method was applied
to obtain the values of coefficients a j and b, which are necessary for making predictions according to Eq. (13.7) as well as for visualizing the fields of regression coefficients using formula (13.10). The optimal values of attenuation factor α f (which
was kept the same for all types of molecular fields) and regularization coefficient
γ were determined by minimizing the root-mean-square error in internal 10-fold
cross-validation performed inside the training set. The same fixed value for all mixing coefficients, h f = 1, was used.
Statistical characteristics of CMF models obtained for these data sets were compared with the same characteristics built for corresponding data sets using the common 3D-QSAR methods, CoMFA (Comparative Molecular Fields Analysis) [18]
and CoMSIA (Comparative Molecular Similarity Index Analysis) [24], based on
the use of molecular fields. Data on CoMFA and CoMSIA models were taken from
Ref. [25].
Statistical parameters of CMF, CoMFA and CoMSIA models are shown in
Table 13.3. They include the values of 4 statistical parameters: q
2
and RMSE cv characterizing internal predictive performance, R
2 p
and RMSE p —external predictive
performance estimated using a single external validation set.
CoMSIA (in Ref. [25]—CoMSIA2) models are based on electrostatic and steric
fields molecular fields and also involve contributions from the hydrophobic and
two hydrogen-bonding molecular fields. All CMF models are based on the use of
all afore-mentioned five types of molecular fields. All CoMFA and CoMSIA models
were obtained by using a lattice with 2 Å spacing expanding at least 4 Å in each direction beyond aligned molecules. Only the most predictive CoMFA and CoMSIA
models are included in the Table 13.3.
For comparing predictive ability of CMF models with those published in literature, all the data sets were split into the training and the test sets as specified
Table 13.2 QSAR DataSets
Ligand data set
Training set Test set
Activity ranging
Angiotensin converting enzyme (ACE) inhibitors 76
38
pIC 50 2.1–9.9
Acetylcholinesterase (AchE) inhibitors
74
37
pIC 50 4.3–9.5
Ligands for benzodiazepine receptors (BZR)
a
98
49
pIC 50 5.5–8.9
Cyclooxygenase-2 (COX-2) inhibitors
a
188
94
pIC 50 4.0–9.0
Dihydrofolatereductase (DHFR) inhibitors
a
237
124
pIC 50 3.3–9.8
Glycogen phosphorylase b (GPB) inhibitors
44
22
pKi 1.3–6.8
Thermolysin (THER) inhibitors
51
25
pKi 0.5–10.2
Thrombine (THR) inhibitors
59
29
pKi 4.4–8.5
a
In the BZR, COX-2, and DHFR data sets several compounds (16, 40, 36, respectively) were
excluded because they did not have the exact experimental values [33]