

399
12 Consensus Drug Design Using IT Microcosm
benzimidazoles, 1,2,4-triazino[2,3-a]benzimidazoles, 1,3,4-thiadiazino[3,2-a]benzimidazoles, thiazolo[2,3f]purines, and oxazolo[2,3-f]purines [105]. The sizes of the
training sets varied from 17 to 459 compounds. A model of a generalized pattern of
1312 condensed azole derivatives is described by 8615 types of QL descriptors (seven
descriptors per compound on average), which testifies to their great structural similarity. Quantitative data for all 28 types of pharmacological activity of these compounds
underwent cluster analysis [59], and four classes of activity were detected: high, moderate, low, and inactive. In each case, the class borders were set using the numerical
values of one or several indices of the tested activity.
In the first series of tests, we evaluated the prediction accuracy of expressed
activity, which corresponds to the combined gradation of “high or moderate” versus
“low or inactive” compounds. The choice of gradations was dictated by the fact that
in an experimental screening of structurally similar compounds, substances with
low or no activity were immediately eliminated from further studies.
A summary of the adequacy of decision rules in predicting expressed activity of
structurally similar compounds is shown in Table 12.7. In this case, the maximum
values F 0 , F a and F n in all strategies amount to 100 % only in the self-prediction
model. In leave-one-out and split-half cross-validations the maximum values of F 0 ,
F a , and F n were 91 %, 100 %, and 96 %, respectively.
The estimates of the accuracy of the best decision rules in predicting an expressed activity are shown in Table 12.8. In this case, the risk strategy showed the
best results; optimum decision rules were obtained for 10 activities out of 21 (48 %).
The summarized results of testing the adequate decision rules in predicting a
high activity level in structurally similar condensed azole derivatives are shown in
Table 12.9. In this case, too, the maximum values for F 0 , F a and F n in all strategies
amount to 100 % only in self-prediction. In leave-one-out and split-half cross-validations the maximum values of F 0 , F a , and F n were 93, 100, and 97 %, respectively.
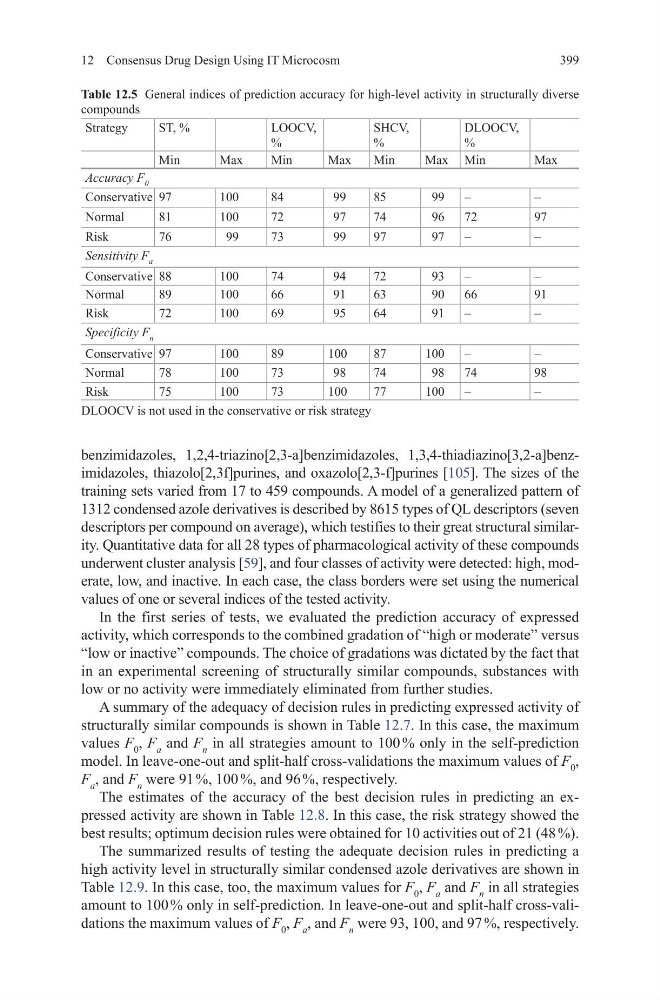
Table 12.5 General indices of prediction accuracy for high-level activity in structurally diverse
compounds
Strategy
ST, %
LOOCV,
%
SHCV,
%
DLOOCV,
%
Min
Max
Min
Max
Min
Max Min
Max
Accuracy F 0
Conservative 97
100
84
99
85
99
–
–
Normal
81
100
72
97
74
96
72
97
Risk
76
99
73
99
97
97
–
–
Sensitivity F a
Conservative 88
100
74
94
72
93
–
–
Normal
89
100
66
91
63
90
66
91
Risk
72
100
69
95
64
91
–
–
Specificity F n
Conservative 97
100
89
100
87
100
–
–
Normal
78
100
73
98
74
98
74
98
Risk
75
100
73
100
77
100
–
–
DLOOCV is not used in the conservative or risk strategy
12 Consensus Drug Design Using IT Microcosm
benzimidazoles, 1,2,4-triazino[2,3-a]benzimidazoles, 1,3,4-thiadiazino[3,2-a]benzimidazoles, thiazolo[2,3f]purines, and oxazolo[2,3-f]purines [105]. The sizes of the
training sets varied from 17 to 459 compounds. A model of a generalized pattern of
1312 condensed azole derivatives is described by 8615 types of QL descriptors (seven
descriptors per compound on average), which testifies to their great structural similarity. Quantitative data for all 28 types of pharmacological activity of these compounds
underwent cluster analysis [59], and four classes of activity were detected: high, moderate, low, and inactive. In each case, the class borders were set using the numerical
values of one or several indices of the tested activity.
In the first series of tests, we evaluated the prediction accuracy of expressed
activity, which corresponds to the combined gradation of “high or moderate” versus
“low or inactive” compounds. The choice of gradations was dictated by the fact that
in an experimental screening of structurally similar compounds, substances with
low or no activity were immediately eliminated from further studies.
A summary of the adequacy of decision rules in predicting expressed activity of
structurally similar compounds is shown in Table 12.7. In this case, the maximum
values F 0 , F a and F n in all strategies amount to 100 % only in the self-prediction
model. In leave-one-out and split-half cross-validations the maximum values of F 0 ,
F a , and F n were 91 %, 100 %, and 96 %, respectively.
The estimates of the accuracy of the best decision rules in predicting an expressed activity are shown in Table 12.8. In this case, the risk strategy showed the
best results; optimum decision rules were obtained for 10 activities out of 21 (48 %).
The summarized results of testing the adequate decision rules in predicting a
high activity level in structurally similar condensed azole derivatives are shown in
Table 12.9. In this case, too, the maximum values for F 0 , F a and F n in all strategies
amount to 100 % only in self-prediction. In leave-one-out and split-half cross-validations the maximum values of F 0 , F a , and F n were 93, 100, and 97 %, respectively.
Table 12.5 General indices of prediction accuracy for high-level activity in structurally diverse
compounds
Strategy
ST, %
LOOCV,
%
SHCV,
%
DLOOCV,
%
Min
Max
Min
Max
Min
Max Min
Max
Accuracy F 0
Conservative 97
100
84
99
85
99
–
–
Normal
81
100
72
97
74
96
72
97
Risk
76
99
73
99
97
97
–
–
Sensitivity F a
Conservative 88
100
74
94
72
93
–
–
Normal
89
100
66
91
63
90
66
91
Risk
72
100
69
95
64
91
–
–
Specificity F n
Conservative 97
100
89
100
87
100
–
–
Normal
78
100
73
98
74
98
74
98
Risk
75
100
73
100
77
100
–
–
DLOOCV is not used in the conservative or risk strategy