

250
M. Melicherčík et al.
0.2 in the middle of membrane [82]. The order parameters calculated based on MD
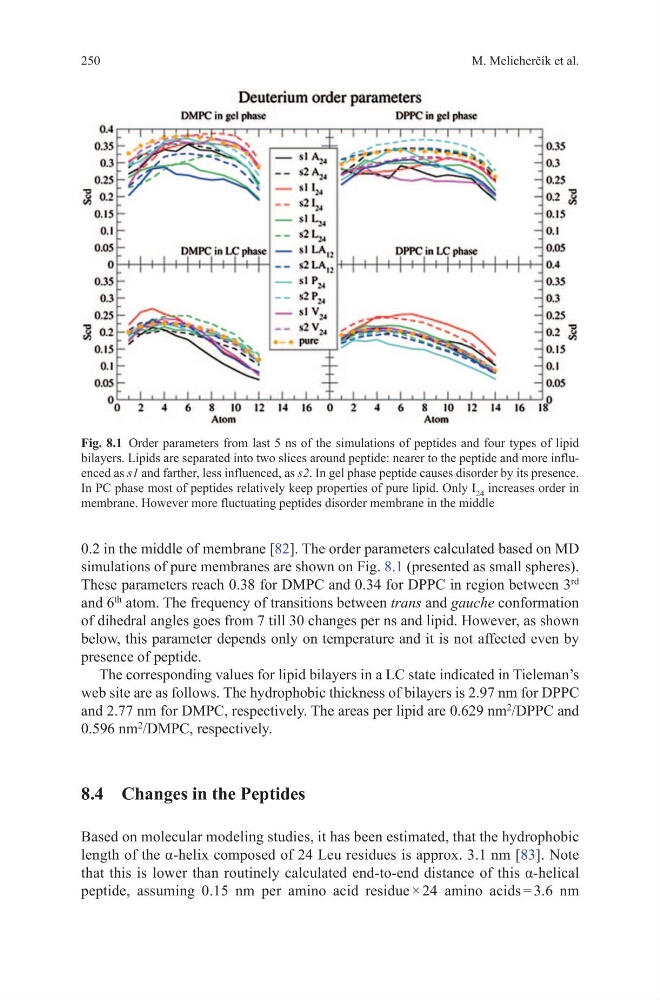
simulations of pure membranes are shown on Fig. 8.1 (presented as small spheres).
These parameters reach 0.38 for DMPC and 0.34 for DPPC in region between 3
rd
and 6
th
atom. The frequency of transitions between trans and gauche conformation
of dihedral angles goes from 7 till 30 changes per ns and lipid. However, as shown
below, this parameter depends only on temperature and it is not affected even by
presence of peptide.
The corresponding values for lipid bilayers in a LC state indicated in Tieleman’s
web site are as follows. The hydrophobic thickness of bilayers is 2.97 nm for DPPC
and 2.77 nm for DMPC, respectively. The areas per lipid are 0.629 nm
2
/DPPC and
0.596 nm
2
/DMPC, respectively.
8.4 Changes in the Peptides
Based on molecular modeling studies, it has been estimated, that the hydrophobic
length of the α-helix composed of 24 Leu residues is approx. 3.1 nm [83]. Note
that this is lower than routinely calculated end-to-end distance of this α-helical
peptide, assuming 0.15 nm per amino acid residue × 24 amino acids = 3.6 nm
Fig. 8.1 Order parameters from last 5 ns of the simulations of peptides and four types of lipid
bilayers. Lipids are separated into two slices around peptide: nearer to the peptide and more influenced as s1 and farther, less influenced, as s2. In gel phase peptide causes disorder by its presence.
In PC phase most of peptides relatively keep properties of pure lipid. Only I 24 increases order in
membrane. However more fluctuating peptides disorder membrane in the middle
M. Melicherčík et al.
0.2 in the middle of membrane [82]. The order parameters calculated based on MD
simulations of pure membranes are shown on Fig. 8.1 (presented as small spheres).
These parameters reach 0.38 for DMPC and 0.34 for DPPC in region between 3
rd
and 6
th
atom. The frequency of transitions between trans and gauche conformation
of dihedral angles goes from 7 till 30 changes per ns and lipid. However, as shown
below, this parameter depends only on temperature and it is not affected even by
presence of peptide.
The corresponding values for lipid bilayers in a LC state indicated in Tieleman’s
web site are as follows. The hydrophobic thickness of bilayers is 2.97 nm for DPPC
and 2.77 nm for DMPC, respectively. The areas per lipid are 0.629 nm
2
/DPPC and
0.596 nm
2
/DMPC, respectively.
8.4 Changes in the Peptides
Based on molecular modeling studies, it has been estimated, that the hydrophobic
length of the α-helix composed of 24 Leu residues is approx. 3.1 nm [83]. Note
that this is lower than routinely calculated end-to-end distance of this α-helical
peptide, assuming 0.15 nm per amino acid residue × 24 amino acids = 3.6 nm
Fig. 8.1 Order parameters from last 5 ns of the simulations of peptides and four types of lipid
bilayers. Lipids are separated into two slices around peptide: nearer to the peptide and more influenced as s1 and farther, less influenced, as s2. In gel phase peptide causes disorder by its presence.
In PC phase most of peptides relatively keep properties of pure lipid. Only I 24 increases order in
membrane. However more fluctuating peptides disorder membrane in the middle