

12
A. Monari and X. Assfeld
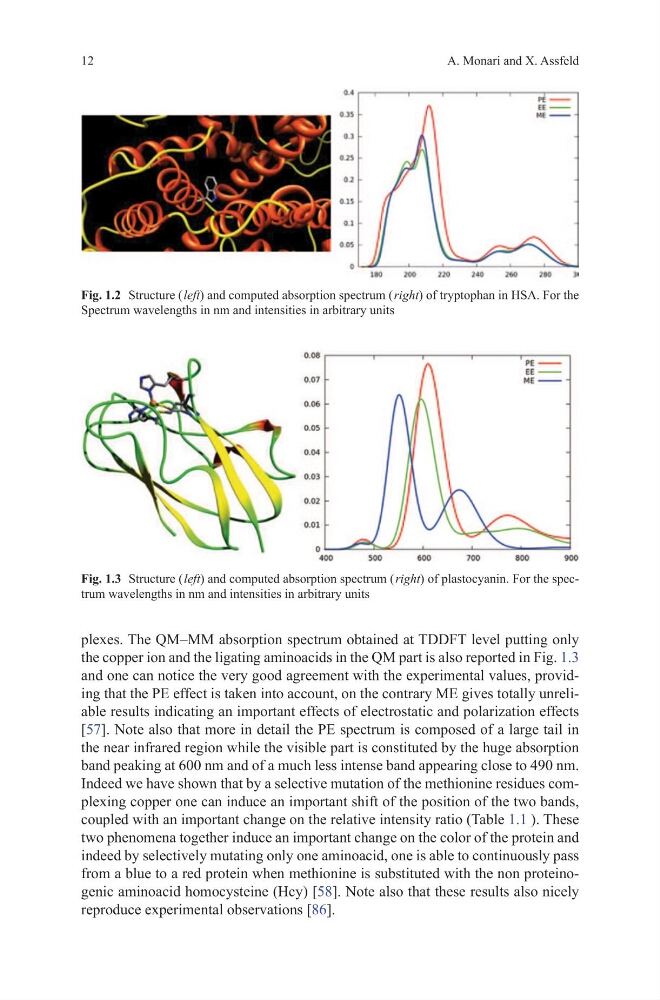
plexes. The QM–MM absorption spectrum obtained at TDDFT level putting only
the copper ion and the ligating aminoacids in the QM part is also reported in Fig. 1.3
and one can notice the very good agreement with the experimental values, providing that the PE effect is taken into account, on the contrary ME gives totally unreliable results indicating an important effects of electrostatic and polarization effects
[57]. Note also that more in detail the PE spectrum is composed of a large tail in
the near infrared region while the visible part is constituted by the huge absorption
band peaking at 600 nm and of a much less intense band appearing close to 490 nm.
Indeed we have shown that by a selective mutation of the methionine residues complexing copper one can induce an important shift of the position of the two bands,
coupled with an important change on the relative intensity ratio (Table 1.1 ). These
two phenomena together induce an important change on the color of the protein and
indeed by selectively mutating only one aminoacid, one is able to continuously pass
from a blue to a red protein when methionine is substituted with the non proteinogenic aminoacid homocysteine (Hcy) [58]. Note also that these results also nicely
reproduce experimental observations [86].
Fig. 1.3 Structure ( left) and computed absorption spectrum ( right) of plastocyanin. For the spectrum wavelengths in nm and intensities in arbitrary units
Fig. 1.2 Structure ( left) and computed absorption spectrum ( right) of tryptophan in HSA. For the
Spectrum wavelengths in nm and intensities in arbitrary units
A. Monari and X. Assfeld
plexes. The QM–MM absorption spectrum obtained at TDDFT level putting only
the copper ion and the ligating aminoacids in the QM part is also reported in Fig. 1.3
and one can notice the very good agreement with the experimental values, providing that the PE effect is taken into account, on the contrary ME gives totally unreliable results indicating an important effects of electrostatic and polarization effects
[57]. Note also that more in detail the PE spectrum is composed of a large tail in
the near infrared region while the visible part is constituted by the huge absorption
band peaking at 600 nm and of a much less intense band appearing close to 490 nm.
Indeed we have shown that by a selective mutation of the methionine residues complexing copper one can induce an important shift of the position of the two bands,
coupled with an important change on the relative intensity ratio (Table 1.1 ). These
two phenomena together induce an important change on the color of the protein and
indeed by selectively mutating only one aminoacid, one is able to continuously pass
from a blue to a red protein when methionine is substituted with the non proteinogenic aminoacid homocysteine (Hcy) [58]. Note also that these results also nicely
reproduce experimental observations [86].
Fig. 1.3 Structure ( left) and computed absorption spectrum ( right) of plastocyanin. For the spectrum wavelengths in nm and intensities in arbitrary units
Fig. 1.2 Structure ( left) and computed absorption spectrum ( right) of tryptophan in HSA. For the
Spectrum wavelengths in nm and intensities in arbitrary units