

224
A. B. Rozhenko
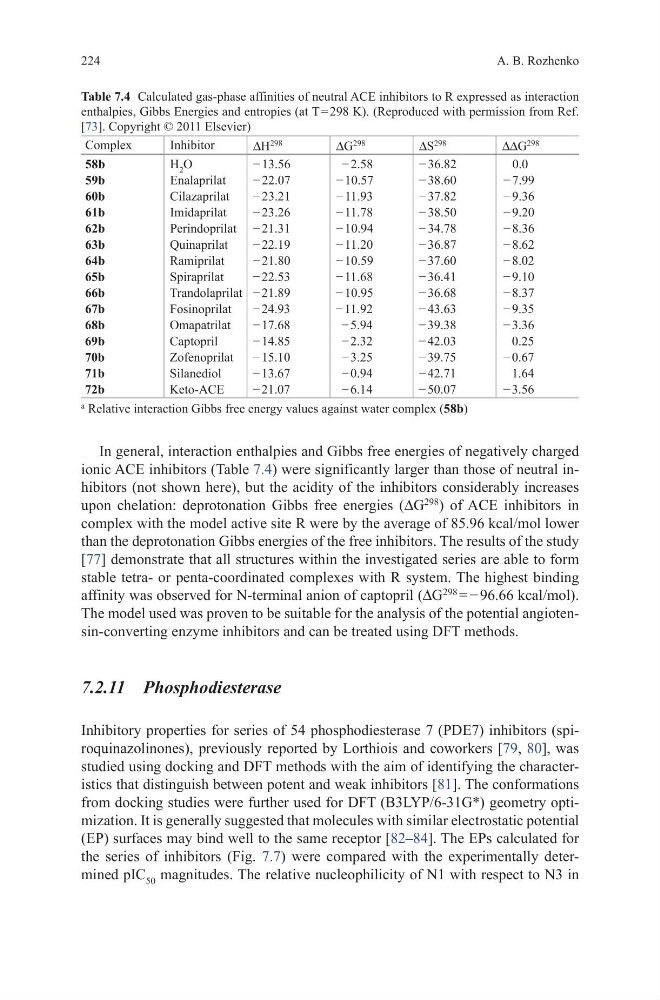
In general, interaction enthalpies and Gibbs free energies of negatively charged
ionic ACE inhibitors (Table 7.4) were significantly larger than those of neutral inhibitors (not shown here), but the acidity of the inhibitors considerably increases
upon chelation: deprotonation Gibbs free energies (∆G
298
) of ACE inhibitors in
complex with the model active site R were by the average of 85.96 kcal/mol lower
than the deprotonation Gibbs energies of the free inhibitors. The results of the study
[77] demonstrate that all structures within the investigated series are able to form
stable tetra- or penta-coordinated complexes with R system. The highest binding
affinity was observed for N-terminal anion of captopril (∆G
298
= − 96.66 kcal/mol).
The model used was proven to be suitable for the analysis of the potential angiotensin-converting enzyme inhibitors and can be treated using DFT methods.
7.2.11 Phosphodiesterase
Inhibitory properties for series of 54 phosphodiesterase 7 (PDE7) inhibitors (spiroquinazolinones), previously reported by Lorthiois and coworkers [79, 80], was
studied using docking and DFT methods with the aim of identifying the characteristics that distinguish between potent and weak inhibitors [81]. The conformations
from docking studies were further used for DFT (B3LYP/6-31G*) geometry optimization. It is generally suggested that molecules with similar electrostatic potential
(EP) surfaces may bind well to the same receptor [82–84]. The EPs calculated for
the series of inhibitors (Fig. 7.7) were compared with the experimentally determined pIC 50 magnitudes. The relative nucleophilicity of N1 with respect to N3 in
Table 7.4 Calculated gas-phase affinities of neutral ACE inhibitors to R expressed as interaction
enthalpies, Gibbs Energies and entropies (at T = 298 K). (Reproduced with permission from Ref.
[73]. Copyright © 2011 Elsevier)
Complex
Inhibitor
∆H
298
∆G
298
∆S
298
∆∆G
298
58b
H 2 O
− 13.56
− 2.58
− 36.82
0.0
59b
Enalaprilat
− 22.07
− 10.57
− 38.60
− 7.99
60b
Cilazaprilat
− 23.21
− 11.93
− 37.82
− 9.36
61b
Imidaprilat
− 23.26
− 11.78
− 38.50
− 9.20
62b
Perindoprilat − 21.31
− 10.94
− 34.78
− 8.36
63b
Quinaprilat
− 22.19
− 11.20
− 36.87
− 8.62
64b
Ramiprilat
− 21.80
− 10.59
− 37.60
− 8.02
65b
Spiraprilat
− 22.53
− 11.68
− 36.41
− 9.10
66b
Trandolaprilat − 21.89
− 10.95
− 36.68
− 8.37
67b
Fosinoprilat
− 24.93
− 11.92
− 43.63
− 9.35
68b
Omapatrilat
− 17.68
− 5.94
− 39.38
− 3.36
69b
Captopril
− 14.85
− 2.32
− 42.03
0.25
70b
Zofenoprilat
− 15.10
− 3.25
− 39.75
− 0.67
71b
Silanediol
− 13.67
− 0.94
− 42.71
1.64
72b
Keto-ACE
− 21.07
− 6.14
− 50.07
− 3.56
a
Relative interaction Gibbs free energy values against water complex (58b)
A. B. Rozhenko
In general, interaction enthalpies and Gibbs free energies of negatively charged
ionic ACE inhibitors (Table 7.4) were significantly larger than those of neutral inhibitors (not shown here), but the acidity of the inhibitors considerably increases
upon chelation: deprotonation Gibbs free energies (∆G
298
) of ACE inhibitors in
complex with the model active site R were by the average of 85.96 kcal/mol lower
than the deprotonation Gibbs energies of the free inhibitors. The results of the study
[77] demonstrate that all structures within the investigated series are able to form
stable tetra- or penta-coordinated complexes with R system. The highest binding
affinity was observed for N-terminal anion of captopril (∆G
298
= − 96.66 kcal/mol).
The model used was proven to be suitable for the analysis of the potential angiotensin-converting enzyme inhibitors and can be treated using DFT methods.
7.2.11 Phosphodiesterase
Inhibitory properties for series of 54 phosphodiesterase 7 (PDE7) inhibitors (spiroquinazolinones), previously reported by Lorthiois and coworkers [79, 80], was
studied using docking and DFT methods with the aim of identifying the characteristics that distinguish between potent and weak inhibitors [81]. The conformations
from docking studies were further used for DFT (B3LYP/6-31G*) geometry optimization. It is generally suggested that molecules with similar electrostatic potential
(EP) surfaces may bind well to the same receptor [82–84]. The EPs calculated for
the series of inhibitors (Fig. 7.7) were compared with the experimentally determined pIC 50 magnitudes. The relative nucleophilicity of N1 with respect to N3 in
Table 7.4 Calculated gas-phase affinities of neutral ACE inhibitors to R expressed as interaction
enthalpies, Gibbs Energies and entropies (at T = 298 K). (Reproduced with permission from Ref.
[73]. Copyright © 2011 Elsevier)
Complex
Inhibitor
∆H
298
∆G
298
∆S
298
∆∆G
298
58b
H 2 O
− 13.56
− 2.58
− 36.82
0.0
59b
Enalaprilat
− 22.07
− 10.57
− 38.60
− 7.99
60b
Cilazaprilat
− 23.21
− 11.93
− 37.82
− 9.36
61b
Imidaprilat
− 23.26
− 11.78
− 38.50
− 9.20
62b
Perindoprilat − 21.31
− 10.94
− 34.78
− 8.36
63b
Quinaprilat
− 22.19
− 11.20
− 36.87
− 8.62
64b
Ramiprilat
− 21.80
− 10.59
− 37.60
− 8.02
65b
Spiraprilat
− 22.53
− 11.68
− 36.41
− 9.10
66b
Trandolaprilat − 21.89
− 10.95
− 36.68
− 8.37
67b
Fosinoprilat
− 24.93
− 11.92
− 43.63
− 9.35
68b
Omapatrilat
− 17.68
− 5.94
− 39.38
− 3.36
69b
Captopril
− 14.85
− 2.32
− 42.03
0.25
70b
Zofenoprilat
− 15.10
− 3.25
− 39.75
− 0.67
71b
Silanediol
− 13.67
− 0.94
− 42.71
1.64
72b
Keto-ACE
− 21.07
− 6.14
− 50.07
− 3.56
a
Relative interaction Gibbs free energy values against water complex (58b)