

44
3 Optimization of the Synthesis of Combinatorial Samples
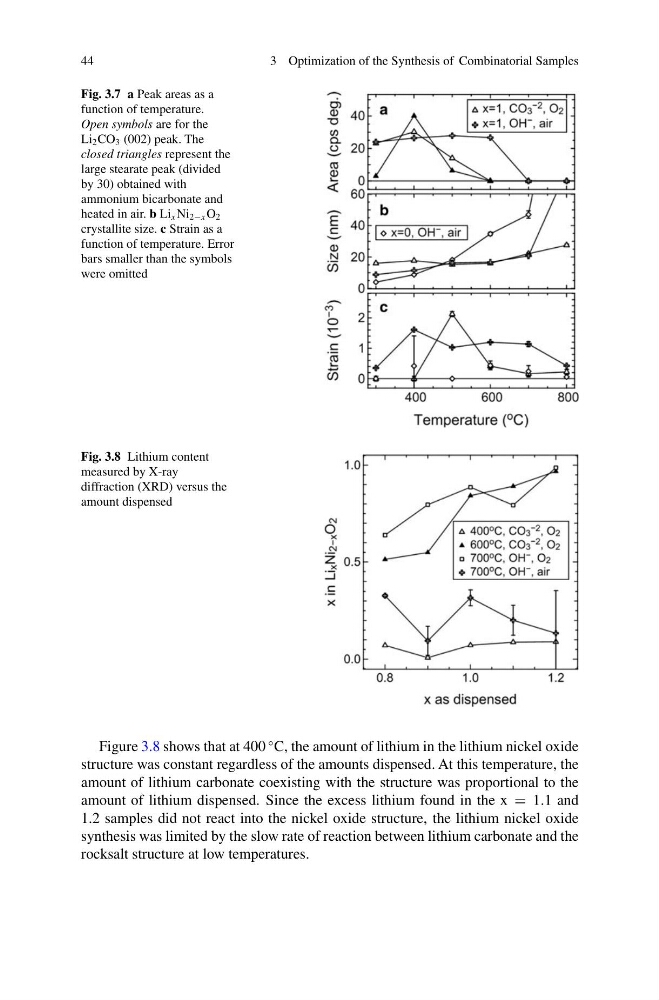
Fig. 3.7 a Peak areas as a
function of temperature.
Open symbols are for the
Li 2 CO 3 (002) peak. The
closed triangles represent the
large stearate peak (divided
by 30) obtained with
ammonium bicarbonate and
heated in air. b Li x Ni 2−x O 2
crystallite size. c Strain as a
function of temperature. Error
bars smaller than the symbols
were omitted
Fig. 3.8 Lithium content
measured by X-ray
diffraction (XRD) versus the
amount dispensed
Figure 3.8 shows that at 400
◦ C, the amount of lithium in the lithium nickel oxide
structure was constant regardless of the amounts dispensed. At this temperature, the
amount of lithium carbonate coexisting with the structure was proportional to the
amount of lithium dispensed. Since the excess lithium found in the x = 1.1 and
1.2 samples did not react into the nickel oxide structure, the lithium nickel oxide
synthesis was limited by the slow rate of reaction between lithium carbonate and the
rocksalt structure at low temperatures.
3 Optimization of the Synthesis of Combinatorial Samples
Fig. 3.7 a Peak areas as a
function of temperature.
Open symbols are for the
Li 2 CO 3 (002) peak. The
closed triangles represent the
large stearate peak (divided
by 30) obtained with
ammonium bicarbonate and
heated in air. b Li x Ni 2−x O 2
crystallite size. c Strain as a
function of temperature. Error
bars smaller than the symbols
were omitted
Fig. 3.8 Lithium content
measured by X-ray
diffraction (XRD) versus the
amount dispensed
Figure 3.8 shows that at 400
◦ C, the amount of lithium in the lithium nickel oxide
structure was constant regardless of the amounts dispensed. At this temperature, the
amount of lithium carbonate coexisting with the structure was proportional to the
amount of lithium dispensed. Since the excess lithium found in the x = 1.1 and
1.2 samples did not react into the nickel oxide structure, the lithium nickel oxide
synthesis was limited by the slow rate of reaction between lithium carbonate and the
rocksalt structure at low temperatures.