

42
3 Optimization of the Synthesis of Combinatorial Samples
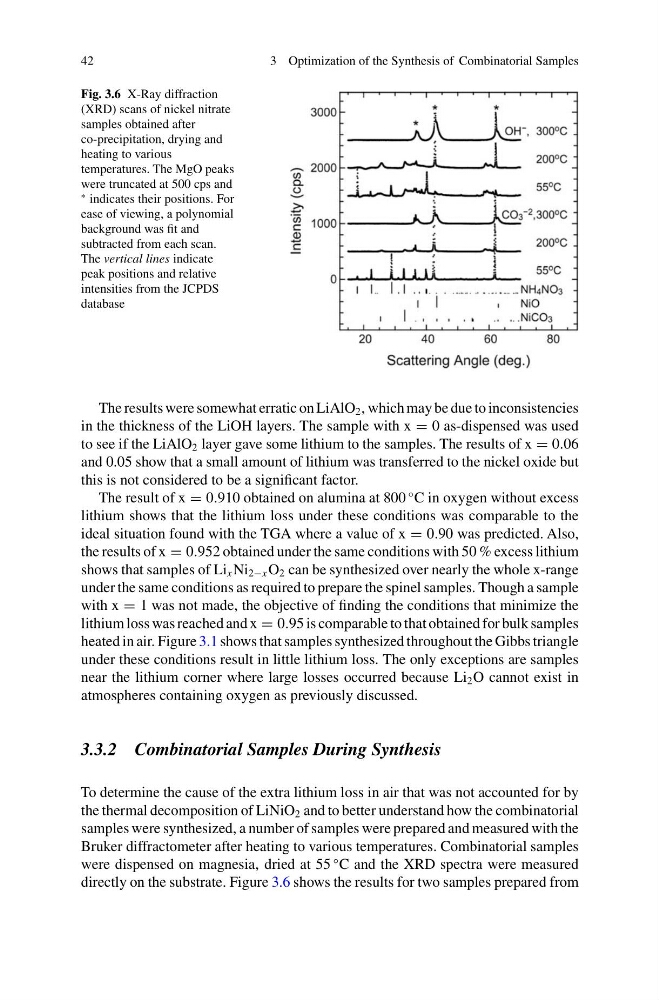
Fig. 3.6 X-Ray diffraction
(XRD) scans of nickel nitrate
samples obtained after
co-precipitation, drying and
heating to various
temperatures. The MgO peaks
were truncated at 500 cps and
∗ indicates their positions. For
ease of viewing, a polynomial
background was fit and
subtracted from each scan.
The vertical lines indicate
peak positions and relative
intensities from the JCPDS
database
The results were somewhat erratic on LiAlO 2 , which may be due to inconsistencies
in the thickness of the LiOH layers. The sample with x = 0 as-dispensed was used
to see if the LiAlO 2 layer gave some lithium to the samples. The results of x = 0.06
and 0.05 show that a small amount of lithium was transferred to the nickel oxide but
this is not considered to be a significant factor.
The result of x = 0.910 obtained on alumina at 800
◦ C in oxygen without excess
lithium shows that the lithium loss under these conditions was comparable to the
ideal situation found with the TGA where a value of x = 0.90 was predicted. Also,
the results of x = 0.952 obtained under the same conditions with 50 % excess lithium
shows that samples of Li x Ni 2−x O 2 can be synthesized over nearly the whole x-range
under the same conditions as required to prepare the spinel samples. Though a sample
with x = 1 was not made, the objective of finding the conditions that minimize the
lithium loss was reached and x = 0.95 is comparable to that obtained for bulk samples
heated in air. Figure 3.1 shows that samples synthesized throughout the Gibbs triangle
under these conditions result in little lithium loss. The only exceptions are samples
near the lithium corner where large losses occurred because Li 2 O cannot exist in
atmospheres containing oxygen as previously discussed.
3.3.2 Combinatorial Samples During Synthesis
To determine the cause of the extra lithium loss in air that was not accounted for by
the thermal decomposition of LiNiO 2 and to better understand how the combinatorial
samples were synthesized, a number of samples were prepared and measured with the
Bruker diffractometer after heating to various temperatures. Combinatorial samples
were dispensed on magnesia, dried at 55
◦ C and the XRD spectra were measured
directly on the substrate. Figure 3.6 shows the results for two samples prepared from
3 Optimization of the Synthesis of Combinatorial Samples
Fig. 3.6 X-Ray diffraction
(XRD) scans of nickel nitrate
samples obtained after
co-precipitation, drying and
heating to various
temperatures. The MgO peaks
were truncated at 500 cps and
∗ indicates their positions. For
ease of viewing, a polynomial
background was fit and
subtracted from each scan.
The vertical lines indicate
peak positions and relative
intensities from the JCPDS
database
The results were somewhat erratic on LiAlO 2 , which may be due to inconsistencies
in the thickness of the LiOH layers. The sample with x = 0 as-dispensed was used
to see if the LiAlO 2 layer gave some lithium to the samples. The results of x = 0.06
and 0.05 show that a small amount of lithium was transferred to the nickel oxide but
this is not considered to be a significant factor.
The result of x = 0.910 obtained on alumina at 800
◦ C in oxygen without excess
lithium shows that the lithium loss under these conditions was comparable to the
ideal situation found with the TGA where a value of x = 0.90 was predicted. Also,
the results of x = 0.952 obtained under the same conditions with 50 % excess lithium
shows that samples of Li x Ni 2−x O 2 can be synthesized over nearly the whole x-range
under the same conditions as required to prepare the spinel samples. Though a sample
with x = 1 was not made, the objective of finding the conditions that minimize the
lithium loss was reached and x = 0.95 is comparable to that obtained for bulk samples
heated in air. Figure 3.1 shows that samples synthesized throughout the Gibbs triangle
under these conditions result in little lithium loss. The only exceptions are samples
near the lithium corner where large losses occurred because Li 2 O cannot exist in
atmospheres containing oxygen as previously discussed.
3.3.2 Combinatorial Samples During Synthesis
To determine the cause of the extra lithium loss in air that was not accounted for by
the thermal decomposition of LiNiO 2 and to better understand how the combinatorial
samples were synthesized, a number of samples were prepared and measured with the
Bruker diffractometer after heating to various temperatures. Combinatorial samples
were dispensed on magnesia, dried at 55
◦ C and the XRD spectra were measured
directly on the substrate. Figure 3.6 shows the results for two samples prepared from