

3.1 Experimental Design
37
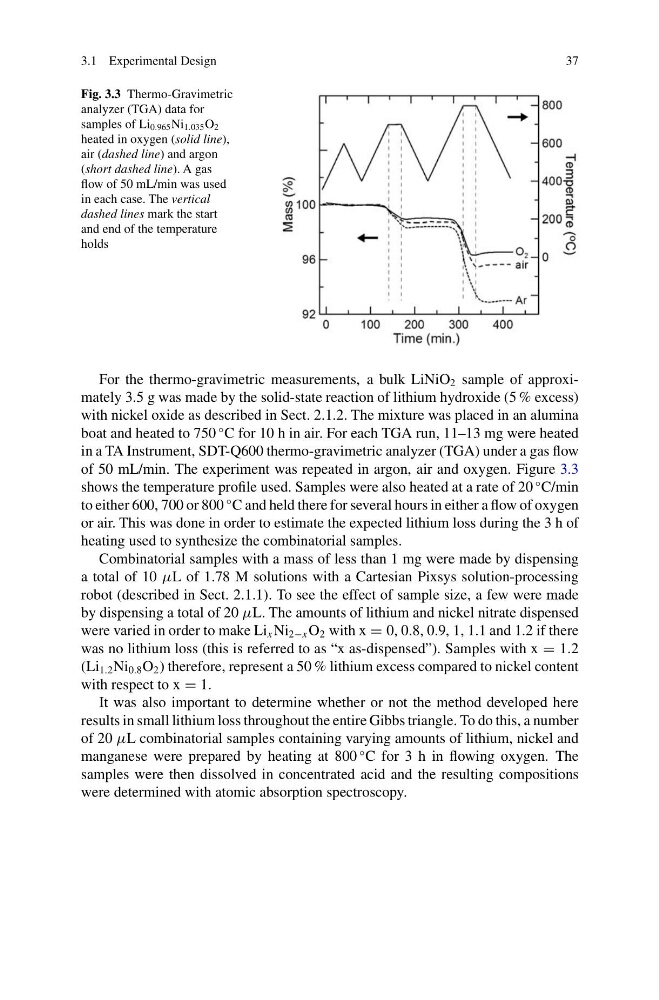
Fig. 3.3 Thermo-Gravimetric
analyzer (TGA) data for
samples of Li 0.965 Ni 1.035 O 2
heated in oxygen (solid line),
air (dashed line) and argon
(short dashed line). A gas
flow of 50 mL/min was used
in each case. The vertical
dashed lines mark the start
and end of the temperature
holds
For the thermo-gravimetric measurements, a bulk LiNiO 2 sample of approximately 3.5 g was made by the solid-state reaction of lithium hydroxide (5 % excess)
with nickel oxide as described in Sect. 2.1.2. The mixture was placed in an alumina
boat and heated to 750
◦ C for 10 h in air. For each TGA run, 11–13 mg were heated
in a TA Instrument, SDT-Q600 thermo-gravimetric analyzer (TGA) under a gas flow
of 50 mL/min. The experiment was repeated in argon, air and oxygen. Figure 3.3
shows the temperature profile used. Samples were also heated at a rate of 20
◦ C/min
to either 600, 700 or 800
◦ C and held there for several hours in either a flow of oxygen
or air. This was done in order to estimate the expected lithium loss during the 3 h of
heating used to synthesize the combinatorial samples.
Combinatorial samples with a mass of less than 1 mg were made by dispensing
a total of 10 μL of 1.78 M solutions with a Cartesian Pixsys solution-processing
robot (described in Sect. 2.1.1). To see the effect of sample size, a few were made
by dispensing a total of 20 μL. The amounts of lithium and nickel nitrate dispensed
were varied in order to make Li x Ni 2−x O 2 with x = 0, 0.8, 0.9, 1, 1.1 and 1.2 if there
was no lithium loss (this is referred to as “x as-dispensed”). Samples with x = 1.2
(Li 1.2 Ni 0.8 O 2 ) therefore, represent a 50 % lithium excess compared to nickel content
with respect to x = 1.
It was also important to determine whether or not the method developed here
results in small lithium loss throughout the entire Gibbs triangle. To do this, a number
of 20 μL combinatorial samples containing varying amounts of lithium, nickel and
manganese were prepared by heating at 800
◦ C for 3 h in flowing oxygen. The
samples were then dissolved in concentrated acid and the resulting compositions
were determined with atomic absorption spectroscopy.
37
Fig. 3.3 Thermo-Gravimetric
analyzer (TGA) data for
samples of Li 0.965 Ni 1.035 O 2
heated in oxygen (solid line),
air (dashed line) and argon
(short dashed line). A gas
flow of 50 mL/min was used
in each case. The vertical
dashed lines mark the start
and end of the temperature
holds
For the thermo-gravimetric measurements, a bulk LiNiO 2 sample of approximately 3.5 g was made by the solid-state reaction of lithium hydroxide (5 % excess)
with nickel oxide as described in Sect. 2.1.2. The mixture was placed in an alumina
boat and heated to 750
◦ C for 10 h in air. For each TGA run, 11–13 mg were heated
in a TA Instrument, SDT-Q600 thermo-gravimetric analyzer (TGA) under a gas flow
of 50 mL/min. The experiment was repeated in argon, air and oxygen. Figure 3.3
shows the temperature profile used. Samples were also heated at a rate of 20
◦ C/min
to either 600, 700 or 800
◦ C and held there for several hours in either a flow of oxygen
or air. This was done in order to estimate the expected lithium loss during the 3 h of
heating used to synthesize the combinatorial samples.
Combinatorial samples with a mass of less than 1 mg were made by dispensing
a total of 10 μL of 1.78 M solutions with a Cartesian Pixsys solution-processing
robot (described in Sect. 2.1.1). To see the effect of sample size, a few were made
by dispensing a total of 20 μL. The amounts of lithium and nickel nitrate dispensed
were varied in order to make Li x Ni 2−x O 2 with x = 0, 0.8, 0.9, 1, 1.1 and 1.2 if there
was no lithium loss (this is referred to as “x as-dispensed”). Samples with x = 1.2
(Li 1.2 Ni 0.8 O 2 ) therefore, represent a 50 % lithium excess compared to nickel content
with respect to x = 1.
It was also important to determine whether or not the method developed here
results in small lithium loss throughout the entire Gibbs triangle. To do this, a number
of 20 μL combinatorial samples containing varying amounts of lithium, nickel and
manganese were prepared by heating at 800
◦ C for 3 h in flowing oxygen. The
samples were then dissolved in concentrated acid and the resulting compositions
were determined with atomic absorption spectroscopy.