

36
3 Optimization of the Synthesis of Combinatorial Samples
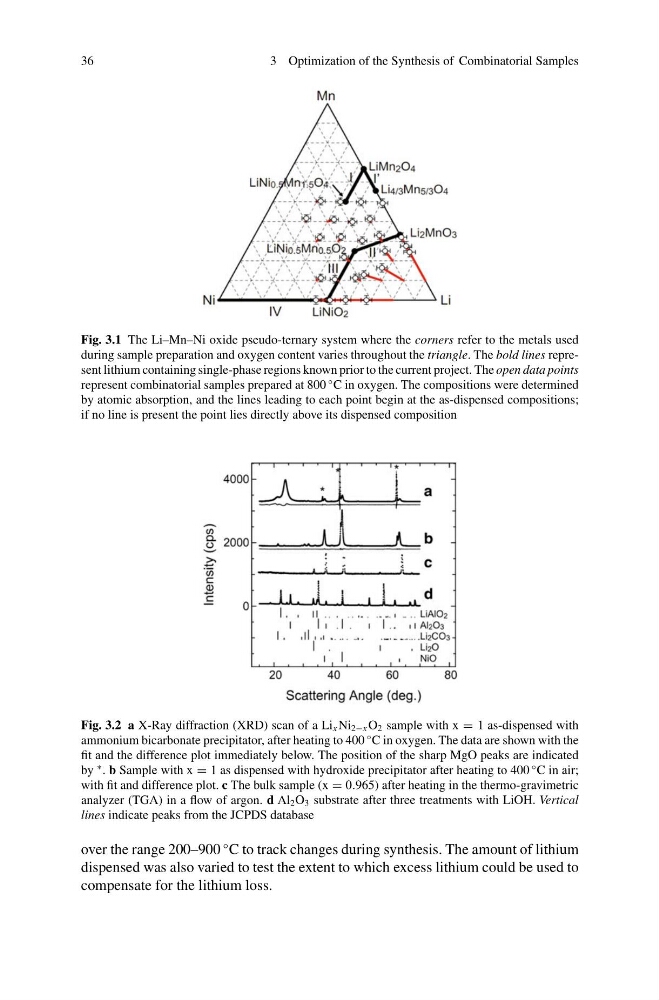
Fig. 3.1 The Li–Mn–Ni oxide pseudo-ternary system where the corners refer to the metals used
during sample preparation and oxygen content varies throughout the triangle. The bold lines represent lithium containing single-phase regions known prior to the current project. The open data points
represent combinatorial samples prepared at 800
◦ C in oxygen. The compositions were determined
by atomic absorption, and the lines leading to each point begin at the as-dispensed compositions;
if no line is present the point lies directly above its dispensed composition
Fig. 3.2 a X-Ray diffraction (XRD) scan of a Li x Ni 2−x O 2 sample with x = 1 as-dispensed with
ammonium bicarbonate precipitator, after heating to 400
◦ C in oxygen. The data are shown with the
fit and the difference plot immediately below. The position of the sharp MgO peaks are indicated
by
∗ . b Sample with x = 1 as dispensed with hydroxide precipitator after heating to 400
◦ C in air;
with fit and difference plot. c The bulk sample (x = 0.965) after heating in the thermo-gravimetric
analyzer (TGA) in a flow of argon. d Al 2 O 3 substrate after three treatments with LiOH. Vertical
lines indicate peaks from the JCPDS database
over the range 200–900
◦ C to track changes during synthesis. The amount of lithium
dispensed was also varied to test the extent to which excess lithium could be used to
compensate for the lithium loss.
3 Optimization of the Synthesis of Combinatorial Samples
Fig. 3.1 The Li–Mn–Ni oxide pseudo-ternary system where the corners refer to the metals used
during sample preparation and oxygen content varies throughout the triangle. The bold lines represent lithium containing single-phase regions known prior to the current project. The open data points
represent combinatorial samples prepared at 800
◦ C in oxygen. The compositions were determined
by atomic absorption, and the lines leading to each point begin at the as-dispensed compositions;
if no line is present the point lies directly above its dispensed composition
Fig. 3.2 a X-Ray diffraction (XRD) scan of a Li x Ni 2−x O 2 sample with x = 1 as-dispensed with
ammonium bicarbonate precipitator, after heating to 400
◦ C in oxygen. The data are shown with the
fit and the difference plot immediately below. The position of the sharp MgO peaks are indicated
by
∗ . b Sample with x = 1 as dispensed with hydroxide precipitator after heating to 400
◦ C in air;
with fit and difference plot. c The bulk sample (x = 0.965) after heating in the thermo-gravimetric
analyzer (TGA) in a flow of argon. d Al 2 O 3 substrate after three treatments with LiOH. Vertical
lines indicate peaks from the JCPDS database
over the range 200–900
◦ C to track changes during synthesis. The amount of lithium
dispensed was also varied to test the extent to which excess lithium could be used to
compensate for the lithium loss.