

1.4 The Li–Mn–Ni–O Face of the Pyramid
15
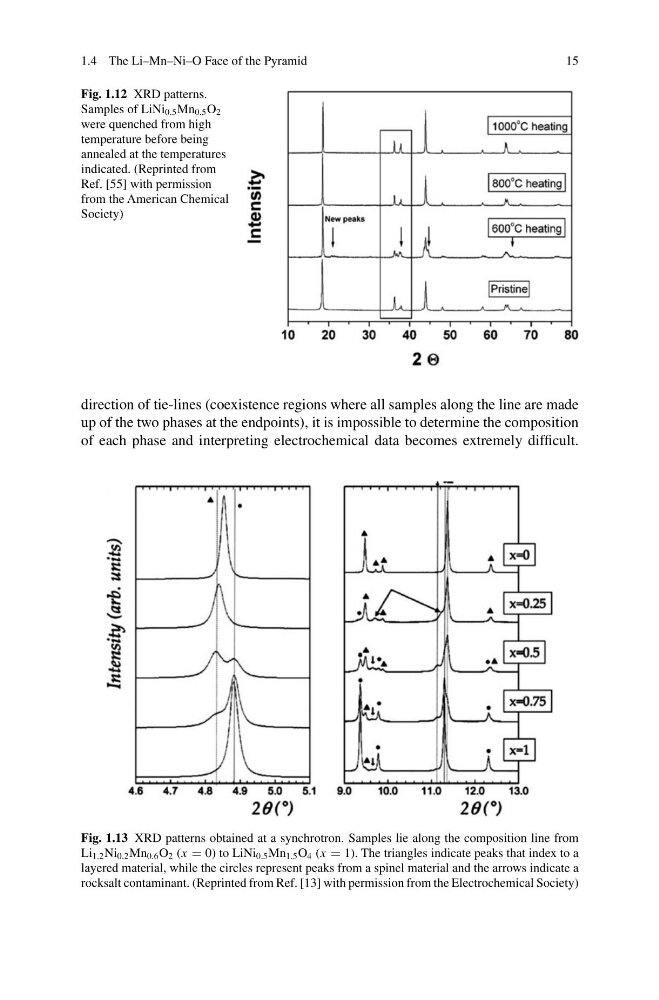
Fig. 1.12 XRD patterns.
Samples of LiNi 0.5 Mn 0.5 O 2
were quenched from high
temperature before being
annealed at the temperatures
indicated. (Reprinted from
Ref. [55] with permission
from the American Chemical
Society)
direction of tie-lines (coexistence regions where all samples along the line are made
up of the two phases at the endpoints), it is impossible to determine the composition
of each phase and interpreting electrochemical data becomes extremely difficult.
Fig. 1.13 XRD patterns obtained at a synchrotron. Samples lie along the composition line from
Li 1.2 Ni 0.2 Mn 0.6 O 2 (x = 0) to LiNi 0.5 Mn 1.5 O 4 (x = 1). The triangles indicate peaks that index to a
layered material, while the circles represent peaks from a spinel material and the arrows indicate a
rocksalt contaminant. (Reprinted from Ref. [13] with permission from the Electrochemical Society)
15
Fig. 1.12 XRD patterns.
Samples of LiNi 0.5 Mn 0.5 O 2
were quenched from high
temperature before being
annealed at the temperatures
indicated. (Reprinted from
Ref. [55] with permission
from the American Chemical
Society)
direction of tie-lines (coexistence regions where all samples along the line are made
up of the two phases at the endpoints), it is impossible to determine the composition
of each phase and interpreting electrochemical data becomes extremely difficult.
Fig. 1.13 XRD patterns obtained at a synchrotron. Samples lie along the composition line from
Li 1.2 Ni 0.2 Mn 0.6 O 2 (x = 0) to LiNi 0.5 Mn 1.5 O 4 (x = 1). The triangles indicate peaks that index to a
layered material, while the circles represent peaks from a spinel material and the arrows indicate a
rocksalt contaminant. (Reprinted from Ref. [13] with permission from the Electrochemical Society)