

8.5 Li[Ni 1/6 P 1/6 Mn 2/3 ]O 2
115
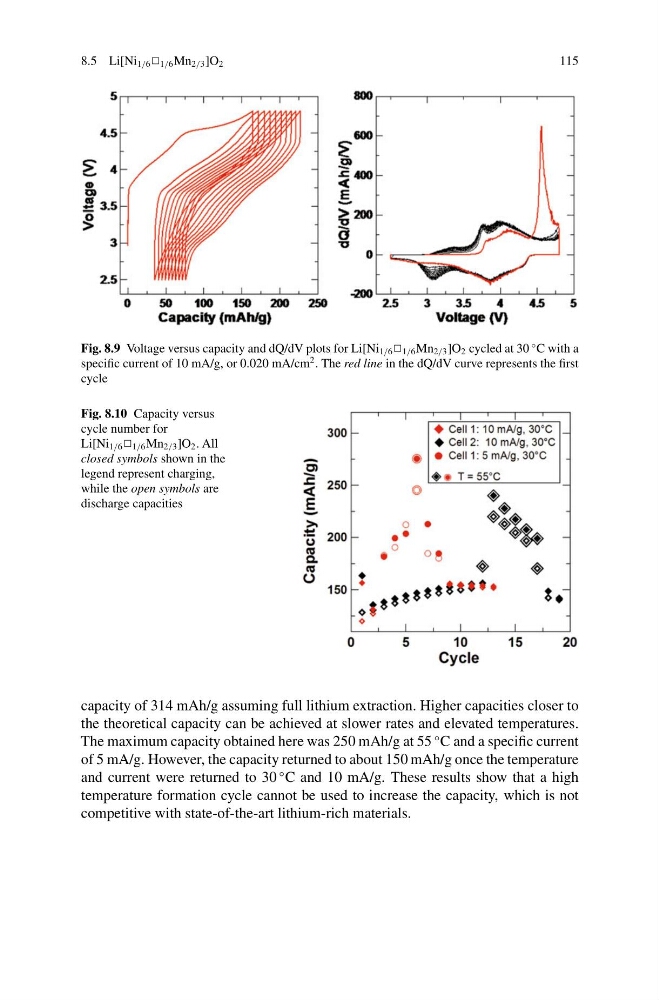
Fig. 8.9 Voltage versus capacity and dQ/dV plots for Li[Ni 1/6 P 1/6 Mn 2/3 ]O 2 cycled at 30
◦ C with a
specific current of 10 mA/g, or 0.020 mA/cm
2 . The red line in the dQ/dV curve represents the first
cycle
Fig. 8.10 Capacity versus
cycle number for
Li[Ni 1/6 P 1/6 Mn 2/3 ]O 2 . All
closed symbols shown in the
legend represent charging,
while the open symbols are
discharge capacities
capacity of 314 mAh/g assuming full lithium extraction. Higher capacities closer to
the theoretical capacity can be achieved at slower rates and elevated temperatures.
The maximum capacity obtained here was 250 mAh/g at 55
◦ C and a specific current
of 5 mA/g. However, the capacity returned to about 150 mAh/g once the temperature
and current were returned to 30
◦ C and 10 mA/g. These results show that a high
temperature formation cycle cannot be used to increase the capacity, which is not
competitive with state-of-the-art lithium-rich materials.
115
Fig. 8.9 Voltage versus capacity and dQ/dV plots for Li[Ni 1/6 P 1/6 Mn 2/3 ]O 2 cycled at 30
◦ C with a
specific current of 10 mA/g, or 0.020 mA/cm
2 . The red line in the dQ/dV curve represents the first
cycle
Fig. 8.10 Capacity versus
cycle number for
Li[Ni 1/6 P 1/6 Mn 2/3 ]O 2 . All
closed symbols shown in the
legend represent charging,
while the open symbols are
discharge capacities
capacity of 314 mAh/g assuming full lithium extraction. Higher capacities closer to
the theoretical capacity can be achieved at slower rates and elevated temperatures.
The maximum capacity obtained here was 250 mAh/g at 55
◦ C and a specific current
of 5 mA/g. However, the capacity returned to about 150 mAh/g once the temperature
and current were returned to 30
◦ C and 10 mA/g. These results show that a high
temperature formation cycle cannot be used to increase the capacity, which is not
competitive with state-of-the-art lithium-rich materials.