

3 Ultrafast Dynamics of Hydrogen Atoms in Hydrocarbon Molecules
57
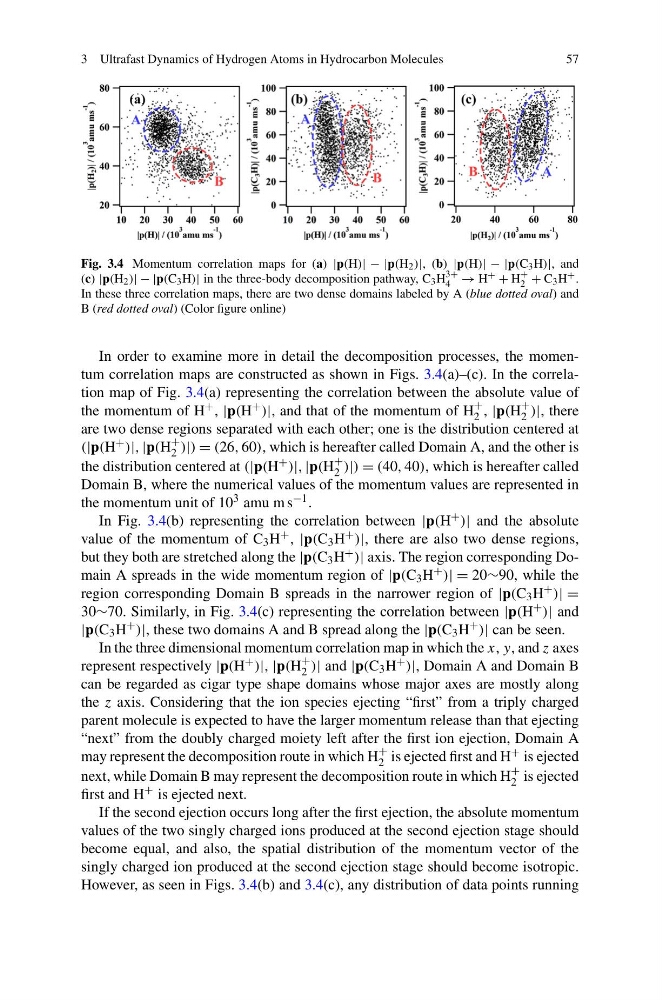
Fig. 3.4 Momentum correlation maps for (a) |p(H)| − |p(H 2 )|, (b) |p(H)| − |p(C 3 H)|, and
(c) |p(H 2 )| − |p(C 3 H)| in the three-body decomposition pathway, C 3 H
3+
4 → H + + H
+
2 + C 3 H + .
In these three correlation maps, there are two dense domains labeled by A (blue dotted oval) and
B (red dotted oval) (Color figure online)
In order to examine more in detail the decomposition processes, the momentum correlation maps are constructed as shown in Figs. 3.4(a)–(c). In the correlation map of Fig. 3.4(a) representing the correlation between the absolute value of
the momentum of H + , |p(H + )|, and that of the momentum of H
+
2 , |p(H
+
2 )|, there
are two dense regions separated with each other; one is the distribution centered at
(|p(H + )|, |p(H
+
2 )|) = (26, 60), which is hereafter called Domain A, and the other is
the distribution centered at (|p(H + )|, |p(H
+
2 )|) = (40, 40), which is hereafter called
Domain B, where the numerical values of the momentum values are represented in
the momentum unit of 10 3 amu m s −1 .
In Fig. 3.4(b) representing the correlation between |p(H + )| and the absolute
value of the momentum of C 3 H + , |p(C 3 H + )|, there are also two dense regions,
but they both are stretched along the |p(C 3 H + )| axis. The region corresponding Domain A spreads in the wide momentum region of |p(C 3 H + )| = 20∼90, while the
region corresponding Domain B spreads in the narrower region of |p(C 3 H + )| =
30∼70. Similarly, in Fig. 3.4(c) representing the correlation between |p(H + )| and
|p(C 3 H + )|, these two domains A and B spread along the |p(C 3 H + )| can be seen.
In the three dimensional momentum correlation map in which the x, y, and z axes
represent respectively |p(H + )|, |p(H
+
2 )| and |p(C 3 H + )|, Domain A and Domain B
can be regarded as cigar type shape domains whose major axes are mostly along
the z axis. Considering that the ion species ejecting “first” from a triply charged
parent molecule is expected to have the larger momentum release than that ejecting
“next” from the doubly charged moiety left after the first ion ejection, Domain A
may represent the decomposition route in which H
+
2 is ejected first and H + is ejected
next, while Domain B may represent the decomposition route in which H
+
2 is ejected
first and H + is ejected next.
If the second ejection occurs long after the first ejection, the absolute momentum
values of the two singly charged ions produced at the second ejection stage should
become equal, and also, the spatial distribution of the momentum vector of the
singly charged ion produced at the second ejection stage should become isotropic.
However, as seen in Figs. 3.4(b) and 3.4(c), any distribution of data points running
57
Fig. 3.4 Momentum correlation maps for (a) |p(H)| − |p(H 2 )|, (b) |p(H)| − |p(C 3 H)|, and
(c) |p(H 2 )| − |p(C 3 H)| in the three-body decomposition pathway, C 3 H
3+
4 → H + + H
+
2 + C 3 H + .
In these three correlation maps, there are two dense domains labeled by A (blue dotted oval) and
B (red dotted oval) (Color figure online)
In order to examine more in detail the decomposition processes, the momentum correlation maps are constructed as shown in Figs. 3.4(a)–(c). In the correlation map of Fig. 3.4(a) representing the correlation between the absolute value of
the momentum of H + , |p(H + )|, and that of the momentum of H
+
2 , |p(H
+
2 )|, there
are two dense regions separated with each other; one is the distribution centered at
(|p(H + )|, |p(H
+
2 )|) = (26, 60), which is hereafter called Domain A, and the other is
the distribution centered at (|p(H + )|, |p(H
+
2 )|) = (40, 40), which is hereafter called
Domain B, where the numerical values of the momentum values are represented in
the momentum unit of 10 3 amu m s −1 .
In Fig. 3.4(b) representing the correlation between |p(H + )| and the absolute
value of the momentum of C 3 H + , |p(C 3 H + )|, there are also two dense regions,
but they both are stretched along the |p(C 3 H + )| axis. The region corresponding Domain A spreads in the wide momentum region of |p(C 3 H + )| = 20∼90, while the
region corresponding Domain B spreads in the narrower region of |p(C 3 H + )| =
30∼70. Similarly, in Fig. 3.4(c) representing the correlation between |p(H + )| and
|p(C 3 H + )|, these two domains A and B spread along the |p(C 3 H + )| can be seen.
In the three dimensional momentum correlation map in which the x, y, and z axes
represent respectively |p(H + )|, |p(H
+
2 )| and |p(C 3 H + )|, Domain A and Domain B
can be regarded as cigar type shape domains whose major axes are mostly along
the z axis. Considering that the ion species ejecting “first” from a triply charged
parent molecule is expected to have the larger momentum release than that ejecting
“next” from the doubly charged moiety left after the first ion ejection, Domain A
may represent the decomposition route in which H
+
2 is ejected first and H + is ejected
next, while Domain B may represent the decomposition route in which H
+
2 is ejected
first and H + is ejected next.
If the second ejection occurs long after the first ejection, the absolute momentum
values of the two singly charged ions produced at the second ejection stage should
become equal, and also, the spatial distribution of the momentum vector of the
singly charged ion produced at the second ejection stage should become isotropic.
However, as seen in Figs. 3.4(b) and 3.4(c), any distribution of data points running