

1 Molecular Movies from Molecular Frame Photoelectron Angular
19
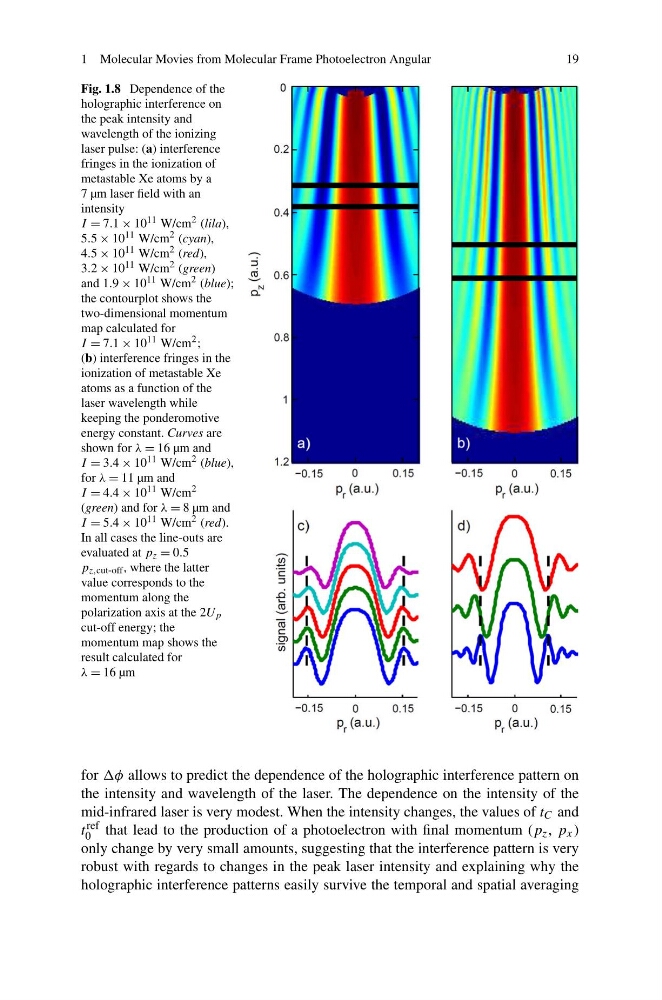
Fig. 1.8 Dependence of the
holographic interference on
the peak intensity and
wavelength of the ionizing
laser pulse: (a) interference
fringes in the ionization of
metastable Xe atoms by a
7 µm laser field with an
intensity
I = 7.1 × 10 11 W/cm
2 (lila),
5.5 × 10 11 W/cm
2 (cyan),
4.5 × 10 11 W/cm
2 (red),
3.2 × 10 11 W/cm
2 (green)
and 1.9 × 10 11 W/cm
2 (blue);
the contourplot shows the
two-dimensional momentum
map calculated for
I = 7.1 × 10 11 W/cm
2 ;
(b) interference fringes in the
ionization of metastable Xe
atoms as a function of the
laser wavelength while
keeping the ponderomotive
energy constant. Curves are
shown for λ = 16 µm and
I = 3.4 × 10 11 W/cm
2 (blue),
for λ = 11 µm and
I = 4.4 × 10 11 W/cm
2
(green) and for λ = 8 µm and
I = 5.4 × 10 11 W/cm
2 (red).
In all cases the line-outs are
evaluated at p z = 0.5
p z,cut-off , where the latter
value corresponds to the
momentum along the
polarization axis at the 2U p
cut-off energy; the
momentum map shows the
result calculated for
λ = 16 µm
for φ allows to predict the dependence of the holographic interference pattern on
the intensity and wavelength of the laser. The dependence on the intensity of the
mid-infrared laser is very modest. When the intensity changes, the values of t C and
t ref
0 that lead to the production of a photoelectron with final momentum (p z , p x )
only change by very small amounts, suggesting that the interference pattern is very
robust with regards to changes in the peak laser intensity and explaining why the
holographic interference patterns easily survive the temporal and spatial averaging
19
Fig. 1.8 Dependence of the
holographic interference on
the peak intensity and
wavelength of the ionizing
laser pulse: (a) interference
fringes in the ionization of
metastable Xe atoms by a
7 µm laser field with an
intensity
I = 7.1 × 10 11 W/cm
2 (lila),
5.5 × 10 11 W/cm
2 (cyan),
4.5 × 10 11 W/cm
2 (red),
3.2 × 10 11 W/cm
2 (green)
and 1.9 × 10 11 W/cm
2 (blue);
the contourplot shows the
two-dimensional momentum
map calculated for
I = 7.1 × 10 11 W/cm
2 ;
(b) interference fringes in the
ionization of metastable Xe
atoms as a function of the
laser wavelength while
keeping the ponderomotive
energy constant. Curves are
shown for λ = 16 µm and
I = 3.4 × 10 11 W/cm
2 (blue),
for λ = 11 µm and
I = 4.4 × 10 11 W/cm
2
(green) and for λ = 8 µm and
I = 5.4 × 10 11 W/cm
2 (red).
In all cases the line-outs are
evaluated at p z = 0.5
p z,cut-off , where the latter
value corresponds to the
momentum along the
polarization axis at the 2U p
cut-off energy; the
momentum map shows the
result calculated for
λ = 16 µm
for φ allows to predict the dependence of the holographic interference pattern on
the intensity and wavelength of the laser. The dependence on the intensity of the
mid-infrared laser is very modest. When the intensity changes, the values of t C and
t ref
0 that lead to the production of a photoelectron with final momentum (p z , p x )
only change by very small amounts, suggesting that the interference pattern is very
robust with regards to changes in the peak laser intensity and explaining why the
holographic interference patterns easily survive the temporal and spatial averaging