

10
A. Rouzée et al.
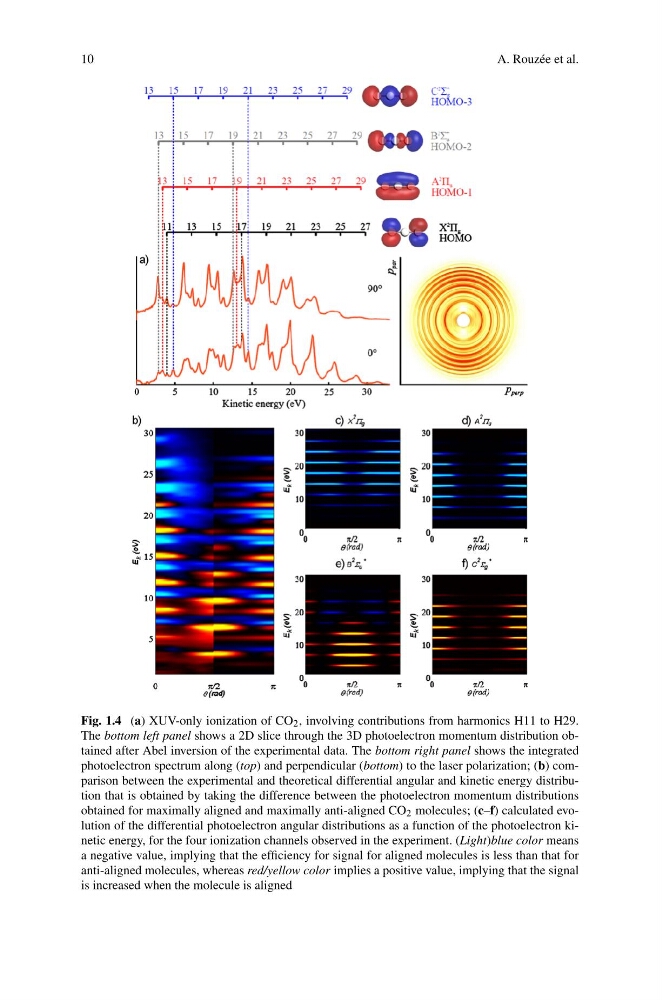
Fig. 1.4 (a) XUV-only ionization of CO 2 , involving contributions from harmonics H11 to H29.
The bottom left panel shows a 2D slice through the 3D photoelectron momentum distribution obtained after Abel inversion of the experimental data. The bottom right panel shows the integrated
photoelectron spectrum along (top) and perpendicular (bottom) to the laser polarization; (b) comparison between the experimental and theoretical differential angular and kinetic energy distribution that is obtained by taking the difference between the photoelectron momentum distributions
obtained for maximally aligned and maximally anti-aligned CO 2 molecules; (c–f) calculated evolution of the differential photoelectron angular distributions as a function of the photoelectron kinetic energy, for the four ionization channels observed in the experiment. (Light)blue color means
a negative value, implying that the efficiency for signal for aligned molecules is less than that for
anti-aligned molecules, whereas red/yellow color implies a positive value, implying that the signal
is increased when the molecule is aligned
A. Rouzée et al.
Fig. 1.4 (a) XUV-only ionization of CO 2 , involving contributions from harmonics H11 to H29.
The bottom left panel shows a 2D slice through the 3D photoelectron momentum distribution obtained after Abel inversion of the experimental data. The bottom right panel shows the integrated
photoelectron spectrum along (top) and perpendicular (bottom) to the laser polarization; (b) comparison between the experimental and theoretical differential angular and kinetic energy distribution that is obtained by taking the difference between the photoelectron momentum distributions
obtained for maximally aligned and maximally anti-aligned CO 2 molecules; (c–f) calculated evolution of the differential photoelectron angular distributions as a function of the photoelectron kinetic energy, for the four ionization channels observed in the experiment. (Light)blue color means
a negative value, implying that the efficiency for signal for aligned molecules is less than that for
anti-aligned molecules, whereas red/yellow color implies a positive value, implying that the signal
is increased when the molecule is aligned