

226
T. Buckup et al.
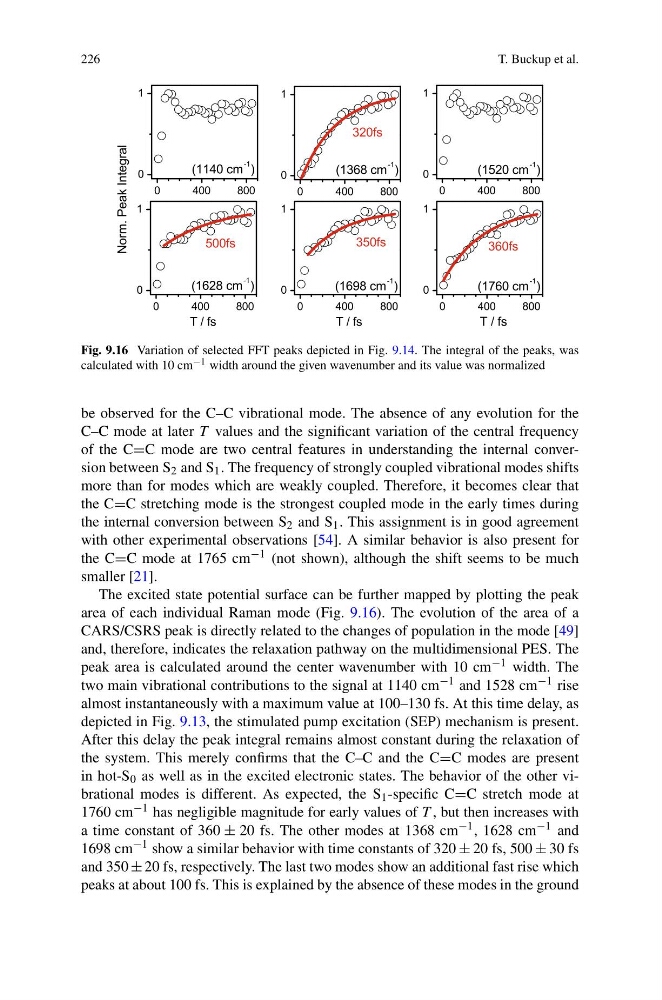
Fig. 9.16 Variation of selected FFT peaks depicted in Fig. 9.14. The integral of the peaks, was
calculated with 10 cm −1 width around the given wavenumber and its value was normalized
be observed for the C–C vibrational mode. The absence of any evolution for the
C–C mode at later T values and the significant variation of the central frequency
of the C=C mode are two central features in understanding the internal conversion between S 2 and S 1 . The frequency of strongly coupled vibrational modes shifts
more than for modes which are weakly coupled. Therefore, it becomes clear that
the C=C stretching mode is the strongest coupled mode in the early times during
the internal conversion between S 2 and S 1 . This assignment is in good agreement
with other experimental observations [54]. A similar behavior is also present for
the C=C mode at 1765 cm −1 (not shown), although the shift seems to be much
smaller [21].
The excited state potential surface can be further mapped by plotting the peak
area of each individual Raman mode (Fig. 9.16). The evolution of the area of a
CARS/CSRS peak is directly related to the changes of population in the mode [49]
and, therefore, indicates the relaxation pathway on the multidimensional PES. The
peak area is calculated around the center wavenumber with 10 cm −1 width. The
two main vibrational contributions to the signal at 1140 cm −1 and 1528 cm −1 rise
almost instantaneously with a maximum value at 100–130 fs. At this time delay, as
depicted in Fig. 9.13, the stimulated pump excitation (SEP) mechanism is present.
After this delay the peak integral remains almost constant during the relaxation of
the system. This merely confirms that the C–C and the C=C modes are present
in hot-S 0 as well as in the excited electronic states. The behavior of the other vibrational modes is different. As expected, the S 1 -specific C=C stretch mode at
1760 cm −1 has negligible magnitude for early values of T , but then increases with
a time constant of 360 ± 20 fs. The other modes at 1368 cm −1 , 1628 cm −1 and
1698 cm −1 show a similar behavior with time constants of 320 ± 20 fs, 500 ± 30 fs
and 350 ± 20 fs, respectively. The last two modes show an additional fast rise which
peaks at about 100 fs. This is explained by the absence of these modes in the ground
T. Buckup et al.
Fig. 9.16 Variation of selected FFT peaks depicted in Fig. 9.14. The integral of the peaks, was
calculated with 10 cm −1 width around the given wavenumber and its value was normalized
be observed for the C–C vibrational mode. The absence of any evolution for the
C–C mode at later T values and the significant variation of the central frequency
of the C=C mode are two central features in understanding the internal conversion between S 2 and S 1 . The frequency of strongly coupled vibrational modes shifts
more than for modes which are weakly coupled. Therefore, it becomes clear that
the C=C stretching mode is the strongest coupled mode in the early times during
the internal conversion between S 2 and S 1 . This assignment is in good agreement
with other experimental observations [54]. A similar behavior is also present for
the C=C mode at 1765 cm −1 (not shown), although the shift seems to be much
smaller [21].
The excited state potential surface can be further mapped by plotting the peak
area of each individual Raman mode (Fig. 9.16). The evolution of the area of a
CARS/CSRS peak is directly related to the changes of population in the mode [49]
and, therefore, indicates the relaxation pathway on the multidimensional PES. The
peak area is calculated around the center wavenumber with 10 cm −1 width. The
two main vibrational contributions to the signal at 1140 cm −1 and 1528 cm −1 rise
almost instantaneously with a maximum value at 100–130 fs. At this time delay, as
depicted in Fig. 9.13, the stimulated pump excitation (SEP) mechanism is present.
After this delay the peak integral remains almost constant during the relaxation of
the system. This merely confirms that the C–C and the C=C modes are present
in hot-S 0 as well as in the excited electronic states. The behavior of the other vibrational modes is different. As expected, the S 1 -specific C=C stretch mode at
1760 cm −1 has negligible magnitude for early values of T , but then increases with
a time constant of 360 ± 20 fs. The other modes at 1368 cm −1 , 1628 cm −1 and
1698 cm −1 show a similar behavior with time constants of 320 ± 20 fs, 500 ± 30 fs
and 350 ± 20 fs, respectively. The last two modes show an additional fast rise which
peaks at about 100 fs. This is explained by the absence of these modes in the ground