

6 Biomolecules, Photostability and 1 πσ ∗ States
131
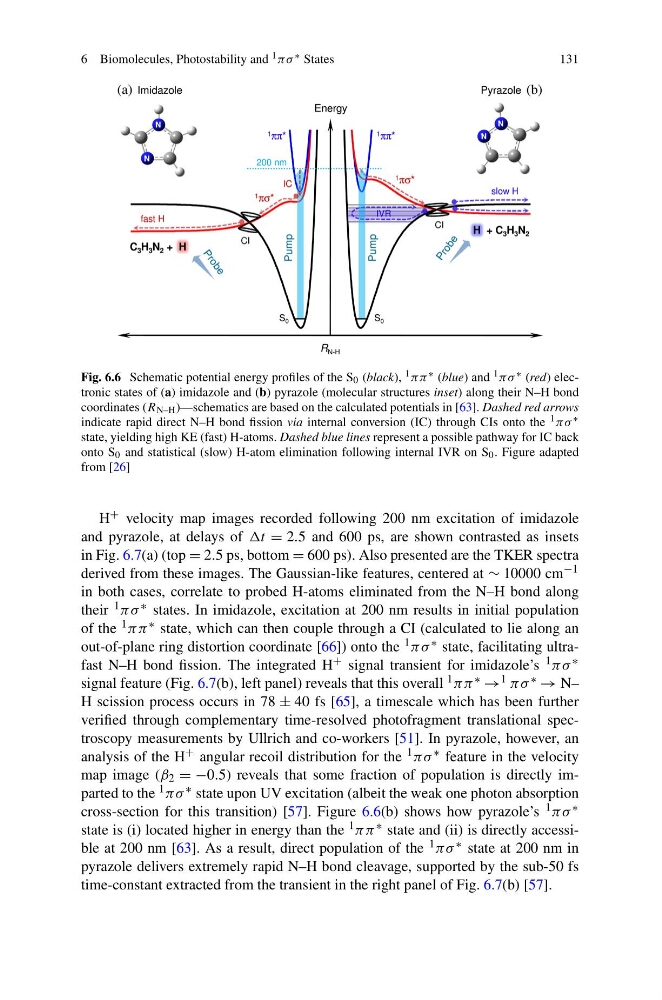
Fig. 6.6 Schematic potential energy profiles of the S 0 (black), 1 ππ ∗ (blue) and 1 πσ ∗ (red) electronic states of (a) imidazole and (b) pyrazole (molecular structures inset) along their N–H bond
coordinates (R N–H )—schematics are based on the calculated potentials in [63]. Dashed red arrows
indicate rapid direct N–H bond fission via internal conversion (IC) through CIs onto the 1 πσ ∗
state, yielding high KE (fast) H-atoms. Dashed blue lines represent a possible pathway for IC back
onto S 0 and statistical (slow) H-atom elimination following internal IVR on S 0 . Figure adapted
from [26]
H + velocity map images recorded following 200 nm excitation of imidazole
and pyrazole, at delays of t = 2.5 and 600 ps, are shown contrasted as insets
in Fig. 6.7(a) (top = 2.5 ps, bottom = 600 ps). Also presented are the TKER spectra
derived from these images. The Gaussian-like features, centered at ∼ 10000 cm −1
in both cases, correlate to probed H-atoms eliminated from the N–H bond along
their 1 πσ ∗ states. In imidazole, excitation at 200 nm results in initial population
of the 1 ππ ∗ state, which can then couple through a CI (calculated to lie along an
out-of-plane ring distortion coordinate [66]) onto the 1 πσ ∗ state, facilitating ultrafast N–H bond fission. The integrated H + signal transient for imidazole’s 1 πσ ∗
signal feature (Fig. 6.7(b), left panel) reveals that this overall 1 ππ ∗ → 1 πσ ∗ → N–
H scission process occurs in 78 ± 40 fs [65], a timescale which has been further
verified through complementary time-resolved photofragment translational spectroscopy measurements by Ullrich and co-workers [51]. In pyrazole, however, an
analysis of the H + angular recoil distribution for the 1 πσ ∗ feature in the velocity
map image (β 2 = −0.5) reveals that some fraction of population is directly imparted to the 1 πσ ∗ state upon UV excitation (albeit the weak one photon absorption
cross-section for this transition) [57]. Figure 6.6(b) shows how pyrazole’s 1 πσ ∗
state is (i) located higher in energy than the 1 ππ ∗ state and (ii) is directly accessible at 200 nm [63]. As a result, direct population of the 1 πσ ∗ state at 200 nm in
pyrazole delivers extremely rapid N–H bond cleavage, supported by the sub-50 fs
time-constant extracted from the transient in the right panel of Fig. 6.7(b) [57].
131
Fig. 6.6 Schematic potential energy profiles of the S 0 (black), 1 ππ ∗ (blue) and 1 πσ ∗ (red) electronic states of (a) imidazole and (b) pyrazole (molecular structures inset) along their N–H bond
coordinates (R N–H )—schematics are based on the calculated potentials in [63]. Dashed red arrows
indicate rapid direct N–H bond fission via internal conversion (IC) through CIs onto the 1 πσ ∗
state, yielding high KE (fast) H-atoms. Dashed blue lines represent a possible pathway for IC back
onto S 0 and statistical (slow) H-atom elimination following internal IVR on S 0 . Figure adapted
from [26]
H + velocity map images recorded following 200 nm excitation of imidazole
and pyrazole, at delays of t = 2.5 and 600 ps, are shown contrasted as insets
in Fig. 6.7(a) (top = 2.5 ps, bottom = 600 ps). Also presented are the TKER spectra
derived from these images. The Gaussian-like features, centered at ∼ 10000 cm −1
in both cases, correlate to probed H-atoms eliminated from the N–H bond along
their 1 πσ ∗ states. In imidazole, excitation at 200 nm results in initial population
of the 1 ππ ∗ state, which can then couple through a CI (calculated to lie along an
out-of-plane ring distortion coordinate [66]) onto the 1 πσ ∗ state, facilitating ultrafast N–H bond fission. The integrated H + signal transient for imidazole’s 1 πσ ∗
signal feature (Fig. 6.7(b), left panel) reveals that this overall 1 ππ ∗ → 1 πσ ∗ → N–
H scission process occurs in 78 ± 40 fs [65], a timescale which has been further
verified through complementary time-resolved photofragment translational spectroscopy measurements by Ullrich and co-workers [51]. In pyrazole, however, an
analysis of the H + angular recoil distribution for the 1 πσ ∗ feature in the velocity
map image (β 2 = −0.5) reveals that some fraction of population is directly imparted to the 1 πσ ∗ state upon UV excitation (albeit the weak one photon absorption
cross-section for this transition) [57]. Figure 6.6(b) shows how pyrazole’s 1 πσ ∗
state is (i) located higher in energy than the 1 ππ ∗ state and (ii) is directly accessible at 200 nm [63]. As a result, direct population of the 1 πσ ∗ state at 200 nm in
pyrazole delivers extremely rapid N–H bond cleavage, supported by the sub-50 fs
time-constant extracted from the transient in the right panel of Fig. 6.7(b) [57].