

6 Biomolecules, Photostability and 1 πσ ∗ States
127
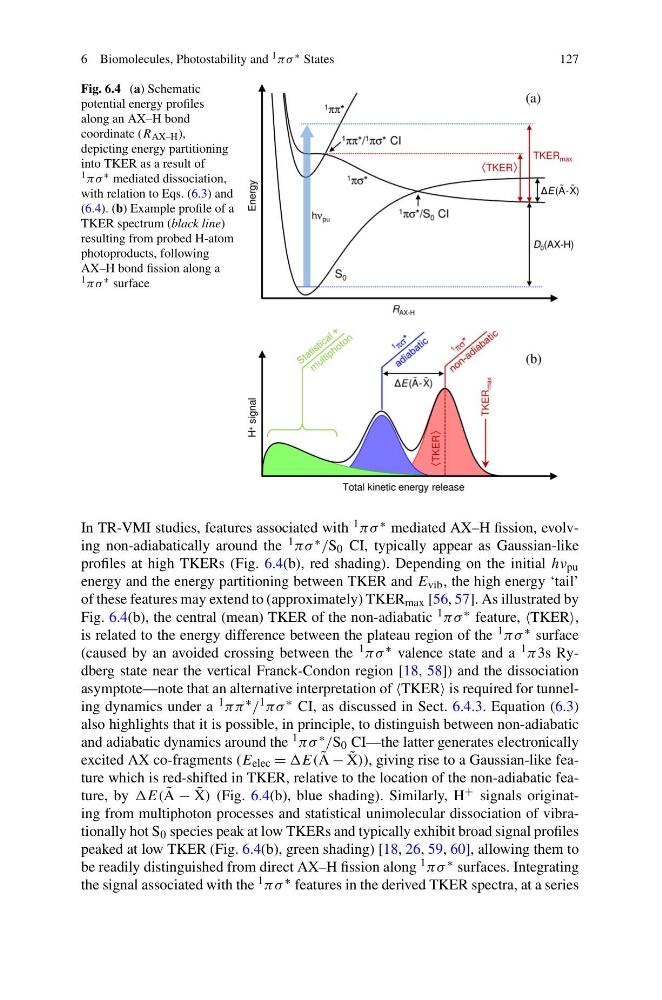
Fig. 6.4 (a) Schematic
potential energy profiles
along an AX–H bond
coordinate (R AX–H ),
depicting energy partitioning
into TKER as a result of
1 πσ ∗ mediated dissociation,
with relation to Eqs. (6.3) and
(6.4). (b) Example profile of a
TKER spectrum (black line)
resulting from probed H-atom
photoproducts, following
AX–H bond fission along a
1 πσ ∗ surface
In TR-VMI studies, features associated with 1 πσ ∗ mediated AX–H fission, evolving non-adiabatically around the 1 πσ ∗ /S 0 CI, typically appear as Gaussian-like
profiles at high TKERs (Fig. 6.4(b), red shading). Depending on the initial hν pu
energy and the energy partitioning between TKER and E vib , the high energy ‘tail’
of these features may extend to (approximately) TKER max [56, 57]. As illustrated by
Fig. 6.4(b), the central (mean) TKER of the non-adiabatic 1 πσ ∗ feature, TKER,
is related to the energy difference between the plateau region of the 1 πσ ∗ surface
(caused by an avoided crossing between the 1 πσ ∗ valence state and a 1 π 3s Rydberg state near the vertical Franck-Condon region [18, 58]) and the dissociation
asymptote—note that an alternative interpretation of TKER is required for tunneling dynamics under a 1 ππ ∗ / 1 πσ ∗ CI, as discussed in Sect. 6.4.3. Equation (6.3)
also highlights that it is possible, in principle, to distinguish between non-adiabatic
and adiabatic dynamics around the 1 πσ ∗ /S 0 CI—the latter generates electronically
excited AX co-fragments (E elec = ˜
A − ˜
X)), giving rise to a Gaussian-like feature which is red-shifted in TKER, relative to the location of the non-adiabatic feature, by E( ˜
A − ˜
X) (Fig. 6.4(b), blue shading). Similarly, H + signals originating from multiphoton processes and statistical unimolecular dissociation of vibrationally hot S 0 species peak at low TKERs and typically exhibit broad signal profiles
peaked at low TKER (Fig. 6.4(b), green shading) [18, 26, 59, 60], allowing them to
be readily distinguished from direct AX–H fission along 1 πσ ∗ surfaces. Integrating
the signal associated with the 1 πσ ∗ features in the derived TKER spectra, at a series
127
Fig. 6.4 (a) Schematic
potential energy profiles
along an AX–H bond
coordinate (R AX–H ),
depicting energy partitioning
into TKER as a result of
1 πσ ∗ mediated dissociation,
with relation to Eqs. (6.3) and
(6.4). (b) Example profile of a
TKER spectrum (black line)
resulting from probed H-atom
photoproducts, following
AX–H bond fission along a
1 πσ ∗ surface
In TR-VMI studies, features associated with 1 πσ ∗ mediated AX–H fission, evolving non-adiabatically around the 1 πσ ∗ /S 0 CI, typically appear as Gaussian-like
profiles at high TKERs (Fig. 6.4(b), red shading). Depending on the initial hν pu
energy and the energy partitioning between TKER and E vib , the high energy ‘tail’
of these features may extend to (approximately) TKER max [56, 57]. As illustrated by
Fig. 6.4(b), the central (mean) TKER of the non-adiabatic 1 πσ ∗ feature, TKER,
is related to the energy difference between the plateau region of the 1 πσ ∗ surface
(caused by an avoided crossing between the 1 πσ ∗ valence state and a 1 π 3s Rydberg state near the vertical Franck-Condon region [18, 58]) and the dissociation
asymptote—note that an alternative interpretation of TKER is required for tunneling dynamics under a 1 ππ ∗ / 1 πσ ∗ CI, as discussed in Sect. 6.4.3. Equation (6.3)
also highlights that it is possible, in principle, to distinguish between non-adiabatic
and adiabatic dynamics around the 1 πσ ∗ /S 0 CI—the latter generates electronically
excited AX co-fragments (E elec = ˜
A − ˜
X)), giving rise to a Gaussian-like feature which is red-shifted in TKER, relative to the location of the non-adiabatic feature, by E( ˜
A − ˜
X) (Fig. 6.4(b), blue shading). Similarly, H + signals originating from multiphoton processes and statistical unimolecular dissociation of vibrationally hot S 0 species peak at low TKERs and typically exhibit broad signal profiles
peaked at low TKER (Fig. 6.4(b), green shading) [18, 26, 59, 60], allowing them to
be readily distinguished from direct AX–H fission along 1 πσ ∗ surfaces. Integrating
the signal associated with the 1 πσ ∗ features in the derived TKER spectra, at a series