

90
6 Engineering Applications of Facility Layout
Table 6.1 Departments for
the metallurgical application
Department
(a) Receiving
(b) Snagging and Inspection
(c) Milling
(d) Automatic Screwing
(e) Welding
(f) Grinding
(g) Plating
(h) Painting
(i) Packing and Warehouse
Table 6.2 Volume, handling capacity, and department sequence for each part
Part
Volume (pieces/year)
Handling capacity (pieces/load)
Sequence
1
5,000
20
(a) (b) (c) (h) (i)
2
12,000
200
(a) (c) (e) (g) (i)
3
600
30
(a) (b) (c) (f) (g) (i)
4
2,000
500
(a) (d) (e) (c) (i)
5
5,000
100
(a) (b) (h) (c) (f) (i)
6
9,000
50
(a) (d) (i)
7
20,000
1,000
(a) (d) (g) (i)
8
2,000
100
(a) (h) (f) (i)
9
1,000
250
(a) (b) (d) (g) (i)
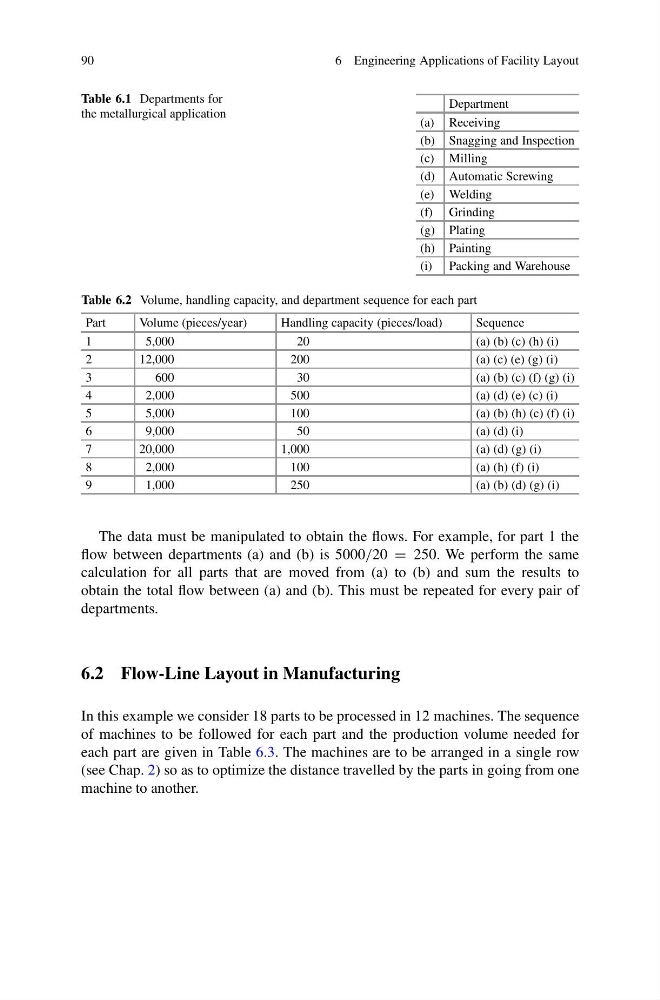
The data must be manipulated to obtain the flows. For example, for part 1 the
flow between departments (a) and (b) is 5000/20 = 250. We perform the same
calculation for all parts that are moved from (a) to (b) and sum the results to
obtain the total flow between (a) and (b). This must be repeated for every pair of
departments.
6.2 Flow-Line Layout in Manufacturing
In this example we consider 18 parts to be processed in 12 machines. The sequence
of machines to be followed for each part and the production volume needed for
each part are given in Table 6.3. The machines are to be arranged in a single row
(see Chap. 2) so as to optimize the distance travelled by the parts in going from one
machine to another.
6 Engineering Applications of Facility Layout
Table 6.1 Departments for
the metallurgical application
Department
(a) Receiving
(b) Snagging and Inspection
(c) Milling
(d) Automatic Screwing
(e) Welding
(f) Grinding
(g) Plating
(h) Painting
(i) Packing and Warehouse
Table 6.2 Volume, handling capacity, and department sequence for each part
Part
Volume (pieces/year)
Handling capacity (pieces/load)
Sequence
1
5,000
20
(a) (b) (c) (h) (i)
2
12,000
200
(a) (c) (e) (g) (i)
3
600
30
(a) (b) (c) (f) (g) (i)
4
2,000
500
(a) (d) (e) (c) (i)
5
5,000
100
(a) (b) (h) (c) (f) (i)
6
9,000
50
(a) (d) (i)
7
20,000
1,000
(a) (d) (g) (i)
8
2,000
100
(a) (h) (f) (i)
9
1,000
250
(a) (b) (d) (g) (i)
The data must be manipulated to obtain the flows. For example, for part 1 the
flow between departments (a) and (b) is 5000/20 = 250. We perform the same
calculation for all parts that are moved from (a) to (b) and sum the results to
obtain the total flow between (a) and (b). This must be repeated for every pair of
departments.
6.2 Flow-Line Layout in Manufacturing
In this example we consider 18 parts to be processed in 12 machines. The sequence
of machines to be followed for each part and the production volume needed for
each part are given in Table 6.3. The machines are to be arranged in a single row
(see Chap. 2) so as to optimize the distance travelled by the parts in going from one
machine to another.