

1.1 From Kinetics to Bimolecular Collisions
7
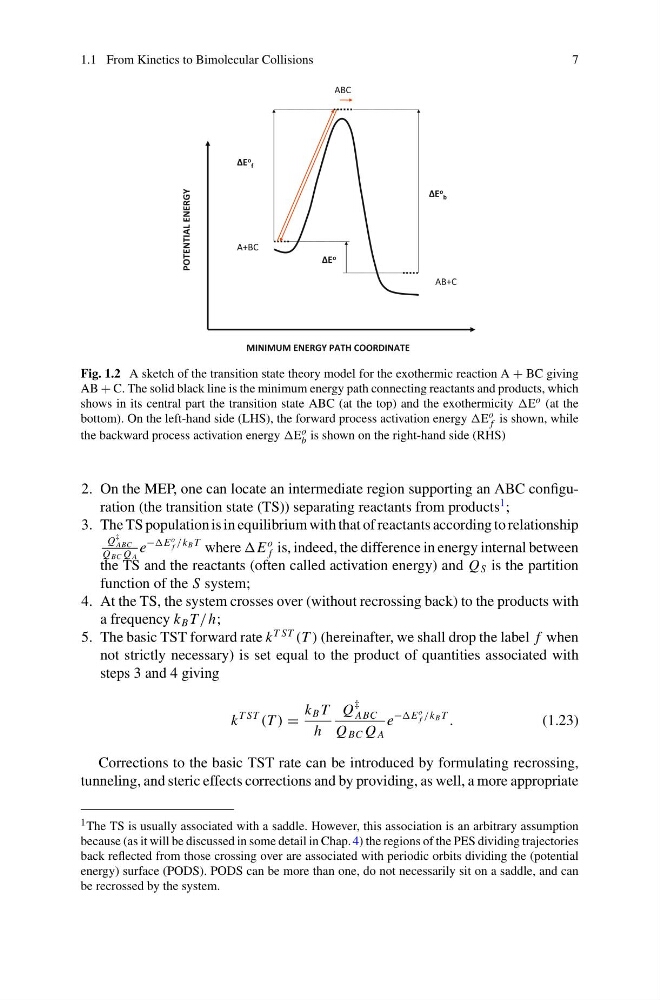
Fig. 1.2 A sketch of the transition state theory model for the exothermic reaction A + BC giving
AB + C. The solid black line is the minimum energy path connecting reactants and products, which
shows in its central part the transition state ABC (at the top) and the exothermicity E o (at the
bottom). On the left-hand side (LHS), the forward process activation energy E o
f is shown, while
the backward process activation energy E o
b is shown on the right-hand side (RHS)
2. On the MEP, one can locate an intermediate region supporting an ABC configuration (the transition state (TS)) separating reactants from products
1 ;
3. The TS population is in equilibrium with that of reactants according to relationship
Q
‡
ABC
Q BC Q A
e
−E
o
f /k B T where E
o
f is, indeed, the difference in energy internal between
the TS and the reactants (often called activation energy) and Q S is the partition
function of the S system;
4. At the TS, the system crosses over (without recrossing back) to the products with
a frequency k B T / h;
5. The basic TST forward rate k
T ST
(T ) (hereinafter, we shall drop the label f when
not strictly necessary) is set equal to the product of quantities associated with
steps 3 and 4 giving
k
T ST
(T ) =
k B T
h
Q
‡
ABC
Q BC Q A
e
−E
o
f /k B T
.
(1.23)
Corrections to the basic TST rate can be introduced by formulating recrossing,
tunneling, and steric effects corrections and by providing, as well, a more appropriate
1 The TS is usually associated with a saddle. However, this association is an arbitrary assumption
because (as it will be discussed in some detail in Chap. 4) the regions of the PES dividing trajectories
back reflected from those crossing over are associated with periodic orbits dividing the (potential
energy) surface (PODS). PODS can be more than one, do not necessarily sit on a saddle, and can
be recrossed by the system.
7
Fig. 1.2 A sketch of the transition state theory model for the exothermic reaction A + BC giving
AB + C. The solid black line is the minimum energy path connecting reactants and products, which
shows in its central part the transition state ABC (at the top) and the exothermicity E o (at the
bottom). On the left-hand side (LHS), the forward process activation energy E o
f is shown, while
the backward process activation energy E o
b is shown on the right-hand side (RHS)
2. On the MEP, one can locate an intermediate region supporting an ABC configuration (the transition state (TS)) separating reactants from products
1 ;
3. The TS population is in equilibrium with that of reactants according to relationship
Q
‡
ABC
Q BC Q A
e
−E
o
f /k B T where E
o
f is, indeed, the difference in energy internal between
the TS and the reactants (often called activation energy) and Q S is the partition
function of the S system;
4. At the TS, the system crosses over (without recrossing back) to the products with
a frequency k B T / h;
5. The basic TST forward rate k
T ST
(T ) (hereinafter, we shall drop the label f when
not strictly necessary) is set equal to the product of quantities associated with
steps 3 and 4 giving
k
T ST
(T ) =
k B T
h
Q
‡
ABC
Q BC Q A
e
−E
o
f /k B T
.
(1.23)
Corrections to the basic TST rate can be introduced by formulating recrossing,
tunneling, and steric effects corrections and by providing, as well, a more appropriate
1 The TS is usually associated with a saddle. However, this association is an arbitrary assumption
because (as it will be discussed in some detail in Chap. 4) the regions of the PES dividing trajectories
back reflected from those crossing over are associated with periodic orbits dividing the (potential
energy) surface (PODS). PODS can be more than one, do not necessarily sit on a saddle, and can
be recrossed by the system.