

4.2 Magnetostructural Correlations
119
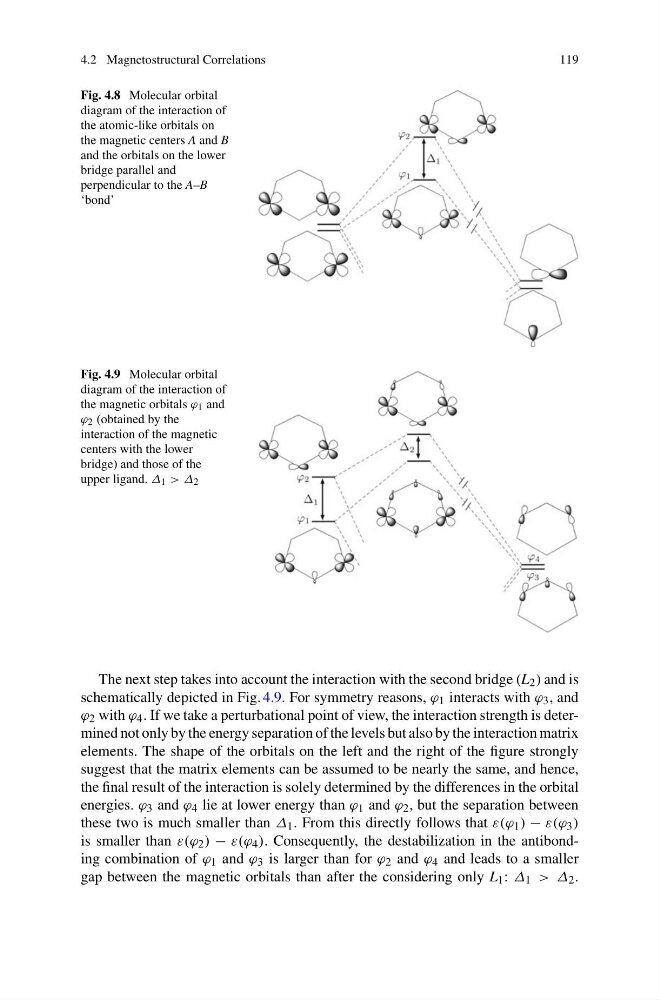
Fig. 4.8 Molecular orbital
diagram of the interaction of
the atomic-like orbitals on
the magnetic centers A and B
and the orbitals on the lower
bridge parallel and
perpendicular to the A–B
‘bond’
Fig. 4.9 Molecular orbital
diagram of the interaction of
the magnetic orbitals ϕ 1 and
ϕ 2 (obtained by the
interaction of the magnetic
centers with the lower
bridge) and those of the
upper ligand. ∆ 1 >∆ 2
The next step takes into account the interaction with the second bridge (L 2 ) and is
schematically depicted in Fig. 4.9. For symmetry reasons, ϕ 1 interacts with ϕ 3 , and
ϕ 2 with ϕ 4 . If we take a perturbational point of view, the interaction strength is determined not only by the energy separation of the levels but also by the interaction matrix
elements. The shape of the orbitals on the left and the right of the figure strongly
suggest that the matrix elements can be assumed to be nearly the same, and hence,
the final result of the interaction is solely determined by the differences in the orbital
energies. ϕ 3 and ϕ 4 lie at lower energy than ϕ 1 and ϕ 2 , but the separation between
these two is much smaller than ∆ 1 . From this directly follows that ε(ϕ 1 ) − ε(ϕ 3 )
is smaller than ε(ϕ 2 ) − ε(ϕ 4 ). Consequently, the destabilization in the antibonding combination of ϕ 1 and ϕ 3 is larger than for ϕ 2 and ϕ 4 and leads to a smaller
gap between the magnetic orbitals than after the considering only L 1 : ∆ 1 >∆ 2 .
119
Fig. 4.8 Molecular orbital
diagram of the interaction of
the atomic-like orbitals on
the magnetic centers A and B
and the orbitals on the lower
bridge parallel and
perpendicular to the A–B
‘bond’
Fig. 4.9 Molecular orbital
diagram of the interaction of
the magnetic orbitals ϕ 1 and
ϕ 2 (obtained by the
interaction of the magnetic
centers with the lower
bridge) and those of the
upper ligand. ∆ 1 >∆ 2
The next step takes into account the interaction with the second bridge (L 2 ) and is
schematically depicted in Fig. 4.9. For symmetry reasons, ϕ 1 interacts with ϕ 3 , and
ϕ 2 with ϕ 4 . If we take a perturbational point of view, the interaction strength is determined not only by the energy separation of the levels but also by the interaction matrix
elements. The shape of the orbitals on the left and the right of the figure strongly
suggest that the matrix elements can be assumed to be nearly the same, and hence,
the final result of the interaction is solely determined by the differences in the orbital
energies. ϕ 3 and ϕ 4 lie at lower energy than ϕ 1 and ϕ 2 , but the separation between
these two is much smaller than ∆ 1 . From this directly follows that ε(ϕ 1 ) − ε(ϕ 3 )
is smaller than ε(ϕ 2 ) − ε(ϕ 4 ). Consequently, the destabilization in the antibonding combination of ϕ 1 and ϕ 3 is larger than for ϕ 2 and ϕ 4 and leads to a smaller
gap between the magnetic orbitals than after the considering only L 1 : ∆ 1 >∆ 2 .