

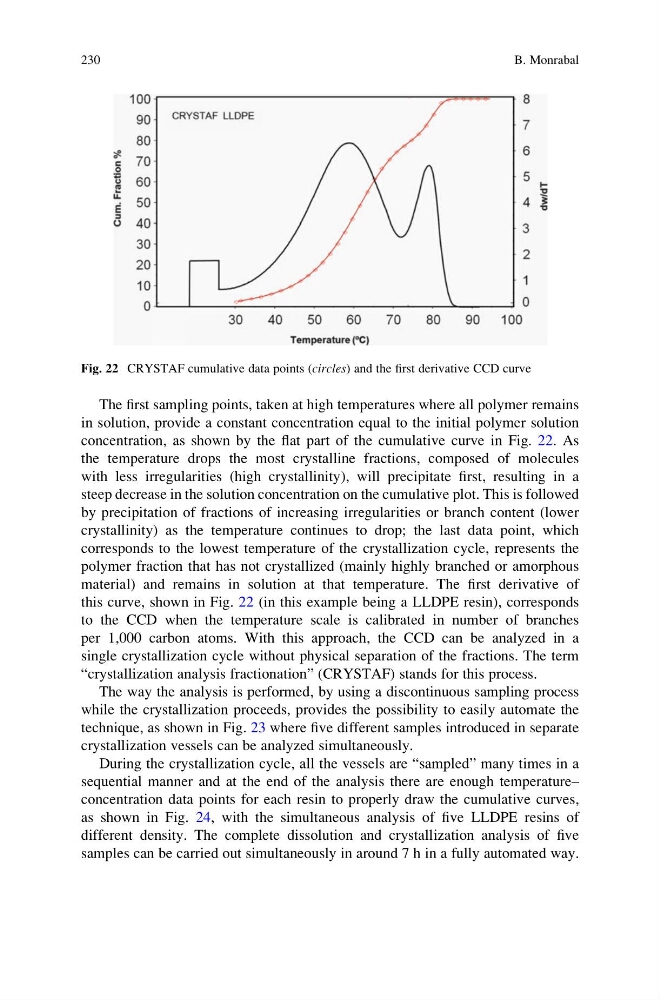
The first sampling points, taken at high temperatures where all polymer remains
in solution, provide a constant concentration equal to the initial polymer solution
concentration, as shown by the flat part of the cumulative curve in Fig. 22. As
the temperature drops the most crystalline fractions, composed of molecules
with less irregularities (high crystallinity), will precipitate first, resulting in a
steep decrease in the solution concentration on the cumulative plot. This is followed
by precipitation of fractions of increasing irregularities or branch content (lower
crystallinity) as the temperature continues to drop; the last data point, which
corresponds to the lowest temperature of the crystallization cycle, represents the
polymer fraction that has not crystallized (mainly highly branched or amorphous
material) and remains in solution at that temperature. The first derivative of
this curve, shown in Fig. 22 (in this example being a LLDPE resin), corresponds
to the CCD when the temperature scale is calibrated in number of branches
per 1,000 carbon atoms. With this approach, the CCD can be analyzed in a
single crystallization cycle without physical separation of the fractions. The term
“crystallization analysis fractionation” (CRYSTAF) stands for this process.
The way the analysis is performed, by using a discontinuous sampling process
while the crystallization proceeds, provides the possibility to easily automate the
technique, as shown in Fig. 23 where five different samples introduced in separate
crystallization vessels can be analyzed simultaneously.
During the crystallization cycle, all the vessels are “sampled” many times in a
sequential manner and at the end of the analysis there are enough temperature–
concentration data points for each resin to properly draw the cumulative curves,
as shown in Fig. 24, with the simultaneous analysis of five LLDPE resins of
different density. The complete dissolution and crystallization analysis of five
samples can be carried out simultaneously in around 7 h in a fully automated way.
Fig. 22 CRYSTAF cumulative data points (circles) and the first derivative CCD curve
230
B. Monrabal
in solution, provide a constant concentration equal to the initial polymer solution
concentration, as shown by the flat part of the cumulative curve in Fig. 22. As
the temperature drops the most crystalline fractions, composed of molecules
with less irregularities (high crystallinity), will precipitate first, resulting in a
steep decrease in the solution concentration on the cumulative plot. This is followed
by precipitation of fractions of increasing irregularities or branch content (lower
crystallinity) as the temperature continues to drop; the last data point, which
corresponds to the lowest temperature of the crystallization cycle, represents the
polymer fraction that has not crystallized (mainly highly branched or amorphous
material) and remains in solution at that temperature. The first derivative of
this curve, shown in Fig. 22 (in this example being a LLDPE resin), corresponds
to the CCD when the temperature scale is calibrated in number of branches
per 1,000 carbon atoms. With this approach, the CCD can be analyzed in a
single crystallization cycle without physical separation of the fractions. The term
“crystallization analysis fractionation” (CRYSTAF) stands for this process.
The way the analysis is performed, by using a discontinuous sampling process
while the crystallization proceeds, provides the possibility to easily automate the
technique, as shown in Fig. 23 where five different samples introduced in separate
crystallization vessels can be analyzed simultaneously.
During the crystallization cycle, all the vessels are “sampled” many times in a
sequential manner and at the end of the analysis there are enough temperature–
concentration data points for each resin to properly draw the cumulative curves,
as shown in Fig. 24, with the simultaneous analysis of five LLDPE resins of
different density. The complete dissolution and crystallization analysis of five
samples can be carried out simultaneously in around 7 h in a fully automated way.
Fig. 22 CRYSTAF cumulative data points (circles) and the first derivative CCD curve
230
B. Monrabal