

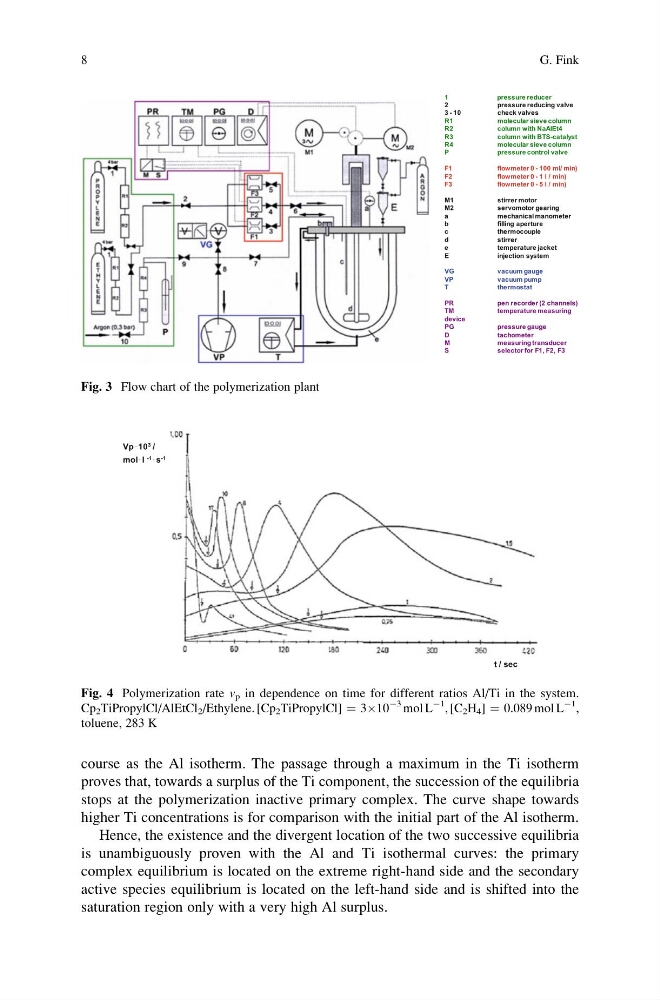
course as the Al isotherm. The passage through a maximum in the Ti isotherm
proves that, towards a surplus of the Ti component, the succession of the equilibria
stops at the polymerization inactive primary complex. The curve shape towards
higher Ti concentrations is for comparison with the initial part of the Al isotherm.
Hence, the existence and the divergent location of the two successive equilibria
is unambiguously proven with the Al and Ti isothermal curves: the primary
complex equilibrium is located on the extreme right-hand side and the secondary
active species equilibrium is located on the left-hand side and is shifted into the
saturation region only with a very high Al surplus.
t / sec
Vp . 10 3 /
mol . l -1 . s -1
Fig. 4 Polymerization rate v p in dependence on time for different ratios Al/Ti in the system.
Cp 2 TiPropylCl/AlEtCl 2 /Ethylene. [Cp 2 TiPropylCl] ¼ 3Â10
À3 mol L
À1
, [C 2 H 4 ] ¼ 0.089 mol L
À1
,
toluene, 283 K
1
pressure reducer
2
pressure reducing valve
3 - 10
check valves
R1
molecular sieve column
R2
column with NaAlEt4
R3
column with BTS-catalyst
R4
molecular sieve column
P
pressure control valve
F1
flowmeter 0 - 100 ml/ min)
F2
flowmeter 0 - 1 l / min)
F3
flowmeter 0 - 5 l / min)
M1
stirrer motor
M2
servomotor gearing
a
mechanical manometer
b
filling aperture
c
thermocouple
d
s t i r r e r
e
temperature jacket
E
injection system
VG
vacuum gauge
VP
vacuum pump
T
thermostat
PR
pen recorder (2 channels)
TM
temperature measuring
device
PG
pressure gauge
D
tachometer
M
measuring transducer
S
selector for F1, F2, F3
Fig. 3 Flow chart of the polymerization plant
8
G. Fink
proves that, towards a surplus of the Ti component, the succession of the equilibria
stops at the polymerization inactive primary complex. The curve shape towards
higher Ti concentrations is for comparison with the initial part of the Al isotherm.
Hence, the existence and the divergent location of the two successive equilibria
is unambiguously proven with the Al and Ti isothermal curves: the primary
complex equilibrium is located on the extreme right-hand side and the secondary
active species equilibrium is located on the left-hand side and is shifted into the
saturation region only with a very high Al surplus.
t / sec
Vp . 10 3 /
mol . l -1 . s -1
Fig. 4 Polymerization rate v p in dependence on time for different ratios Al/Ti in the system.
Cp 2 TiPropylCl/AlEtCl 2 /Ethylene. [Cp 2 TiPropylCl] ¼ 3Â10
À3 mol L
À1
, [C 2 H 4 ] ¼ 0.089 mol L
À1
,
toluene, 283 K
1
pressure reducer
2
pressure reducing valve
3 - 10
check valves
R1
molecular sieve column
R2
column with NaAlEt4
R3
column with BTS-catalyst
R4
molecular sieve column
P
pressure control valve
F1
flowmeter 0 - 100 ml/ min)
F2
flowmeter 0 - 1 l / min)
F3
flowmeter 0 - 5 l / min)
M1
stirrer motor
M2
servomotor gearing
a
mechanical manometer
b
filling aperture
c
thermocouple
d
s t i r r e r
e
temperature jacket
E
injection system
VG
vacuum gauge
VP
vacuum pump
T
thermostat
PR
pen recorder (2 channels)
TM
temperature measuring
device
PG
pressure gauge
D
tachometer
M
measuring transducer
S
selector for F1, F2, F3
Fig. 3 Flow chart of the polymerization plant
8
G. Fink